About Hoots
Hoots connect trusted, governed data in data.world to the tools and reports business users rely on every day. Once enabled, Hoots appear directly within supported BI and analytics pages—such as Tableau dashboards or Power BI reports—via the data.world Browser Extension for Chrome or Edge.
Administrators can publish Hoots by enabling them for collections or business terms, ensuring that key insights, status updates, and data quality signals are visible to end users wherever they work with data. Hoot statuses automatically stay in sync with their connected catalog resources, keeping users informed with the most current information.
Important
This feature is available exclusively for Public Preview to Enterprise customers on Private instance and Single Tenant instance installations.
To increase the trust and confidence of your data consumers, add a trust badge on the dashboards, called a Hoot. Hoots let you curate the parts of the catalog that are important to the data consumers and surface them easily on the dashboards. These provide real-time information to users on the assets, without having to consult the catalog or constantly monitor channels like emails and slack messages for current status.
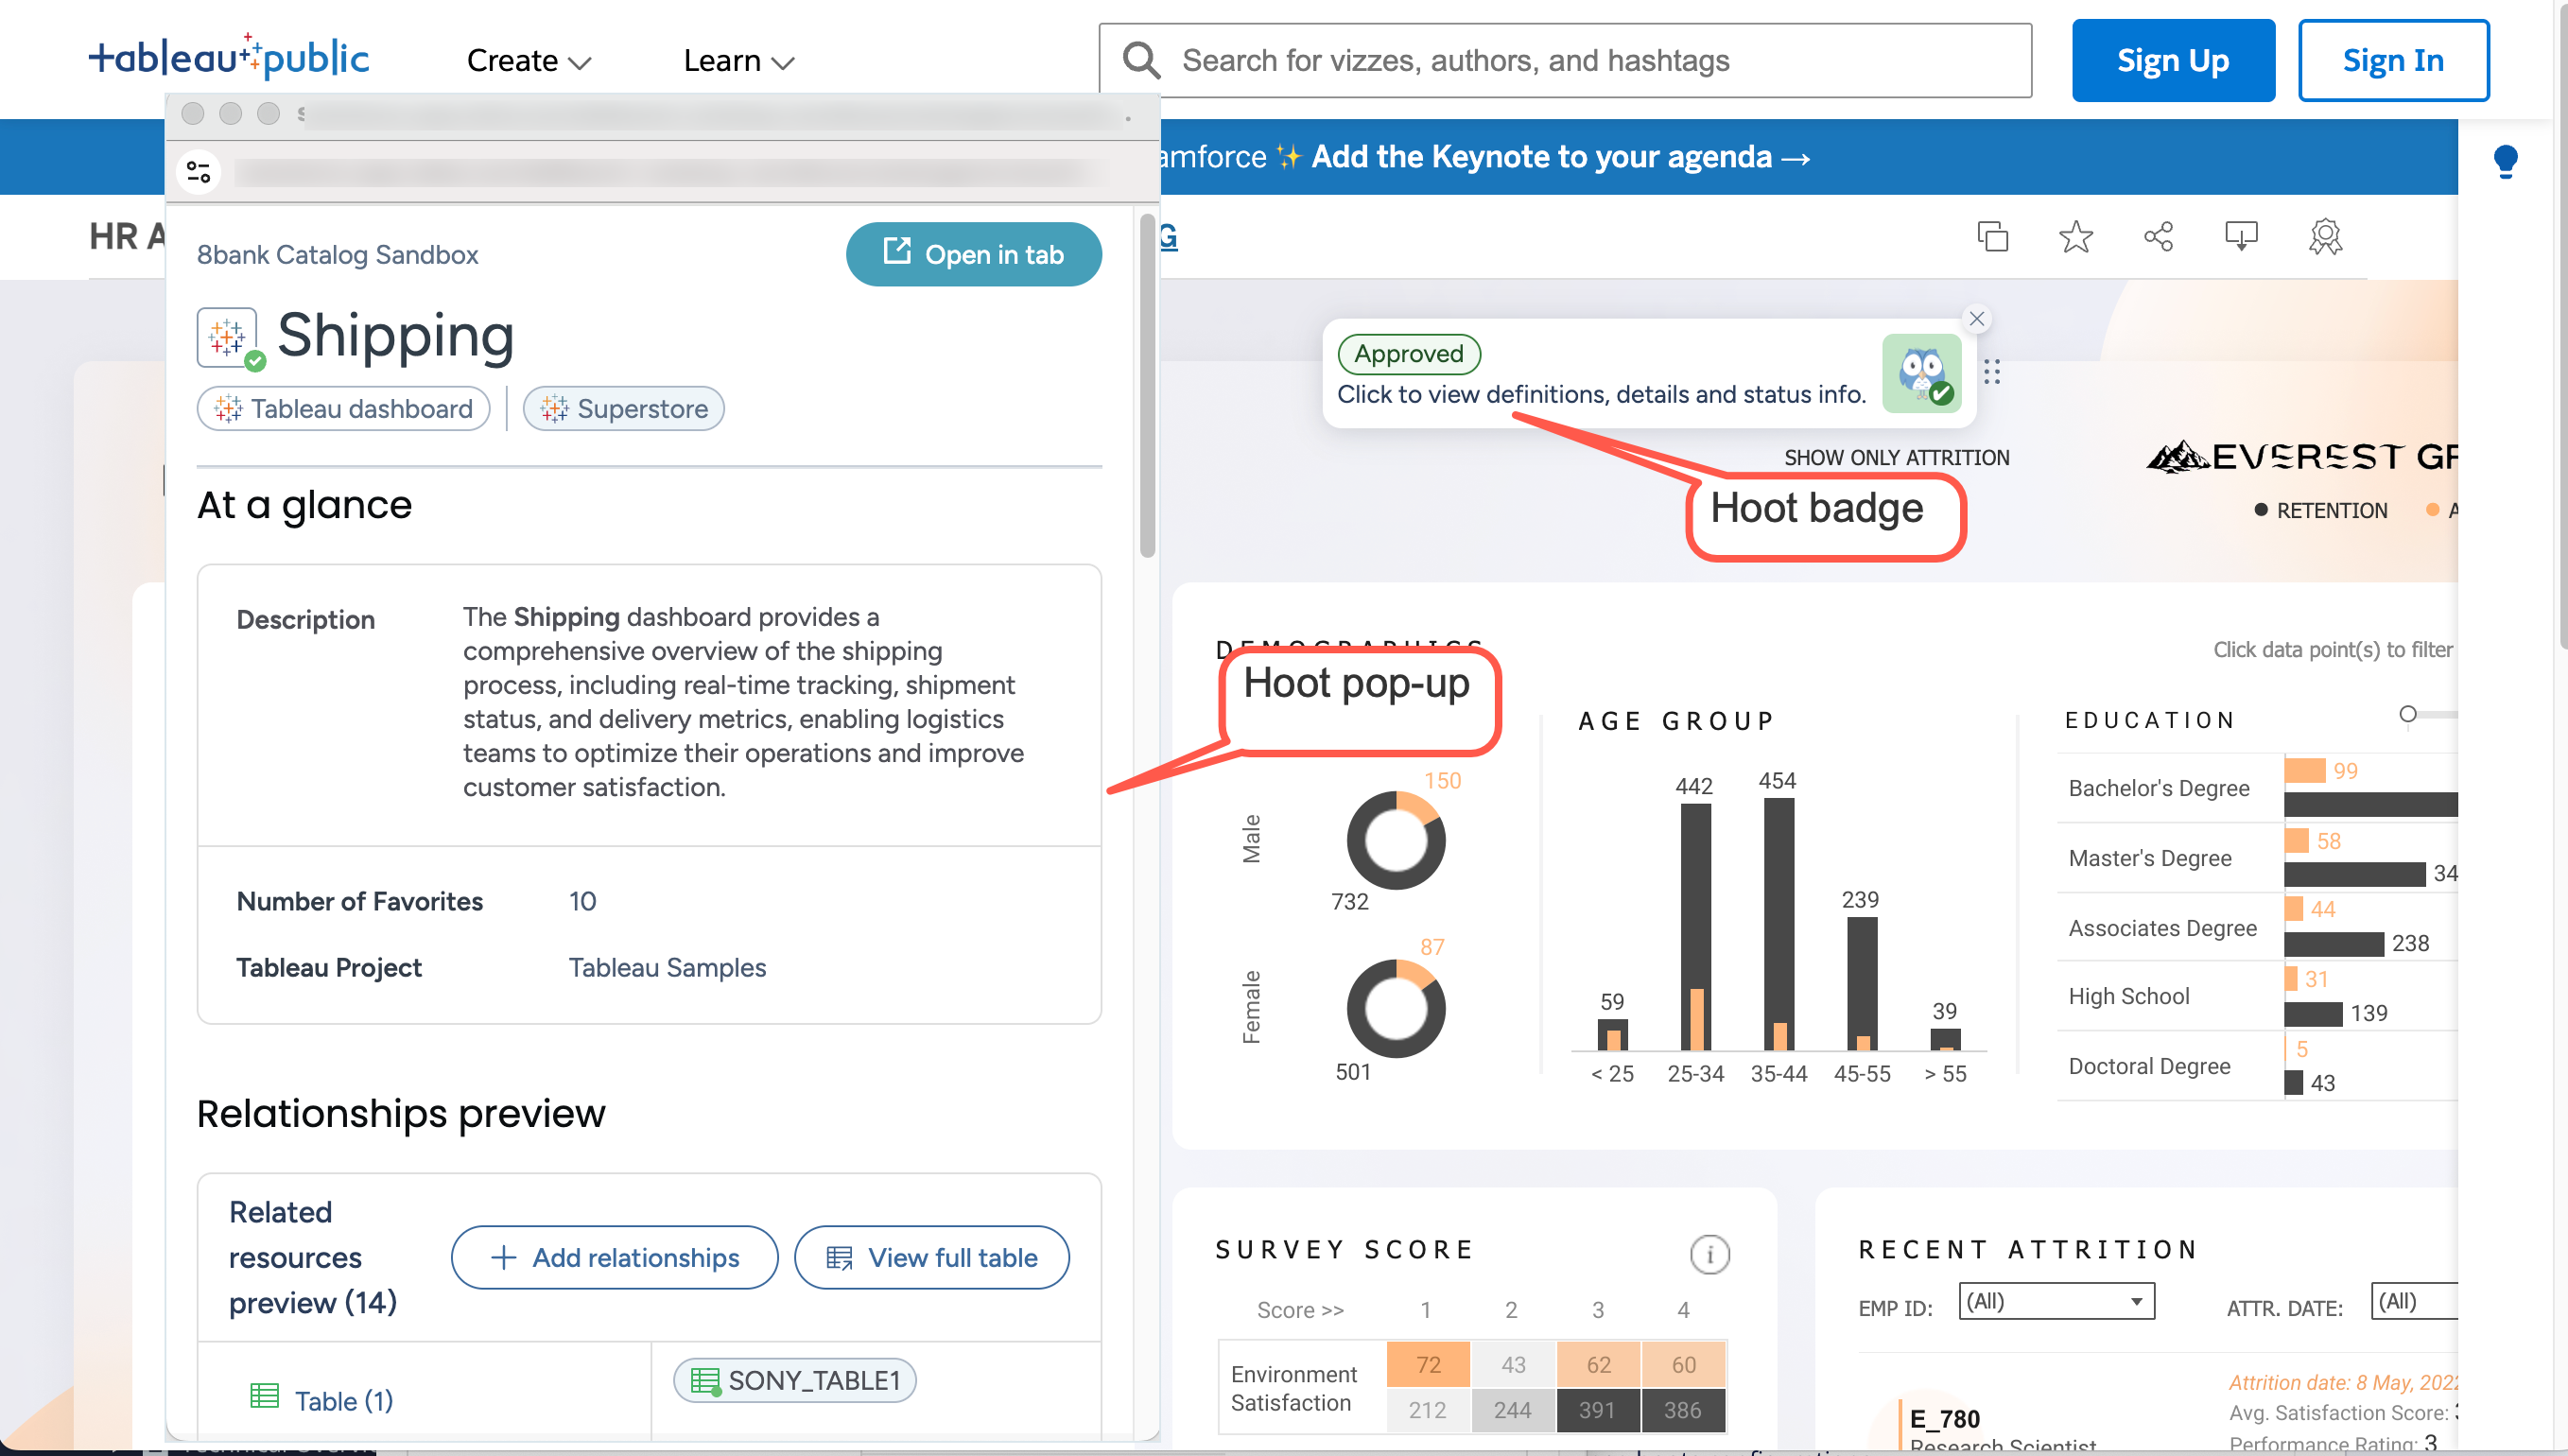
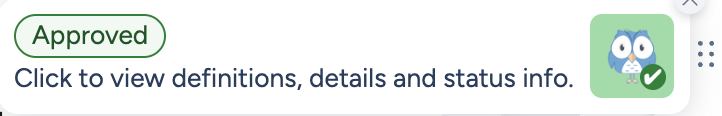
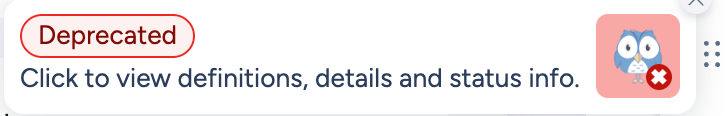
The Hoot badges are designed to be very simple, and provide 4 types of indicators to the users:
Positive - Green status: The data is healthy and has no known issues.
Negative - Red status: There are serious issues with the data and it needs attention.
Gray -Neutral status: Is a warning that there might be issues and someone is looking into them and use the data with caution.
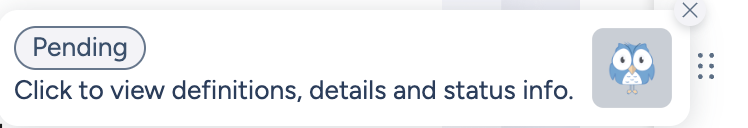
Gray - no status: No status is set for the hoot.
These badges are available to all users even if they do not have access to the complete catalog. Users who do have catalog access can expand to a more detailed view to automatically obtain comprehensive resource information (like related resources, etc.) from the catalog. Any changes made to the resource in the catalog are automatically reflected on the Hoot page. For example, if you add or remove a related resource, it is immediately reflected on the Hoot.
Hoot enablement happens in bulk at a collection-level. Users with Edit privilege on resources and collections can manage hoots configurations.
Why would you use hoots?
Hoots provide trust in the governance of the analysis resources. If a stakeholder sees the Hoot they know the resource is being monitored by the data team and they can quickly get a color-coded signal regarding the health of the analysis resources. Red = sick, Green = happy, Gray = neutral. These correspond with the Negative, Positive, and Neutral asset status available for catalog resources.
Key user personas and use cases for hoots
Hoots serve both business users and data teams by bridging trust and communication around analytics resources. They help business users understand the reliability of reports and give data teams a way to communicate data quality, governance, and ownership transparently.
User persona | Description | Use case |
|---|---|---|
Business users | As data and analytics reach more employees—many with limited data literacy—business users need simple signals to understand whether they can trust a report. Hoots provide an easy, low-effort way to assess data trustworthiness and access help when needed. |
|
Data teams | Data teams operate in fast-changing environments where business priorities shift frequently. They also face shadow BI, where alternate, unverified reports circulate. Hoots act as the team’s stamp of approval, signaling verified and trustworthy data. |
|
An overview of how hoots are published to end users
Hoots are made visible to end users through collections, business terms, and the data.world browser extension. The way you configure and publish Hoots determines where and how users see them.
Enabling the Hoots browser extension module in CTK: Follow these instructions to enable the Hoots browser extension module via CTK.
Enabling hoots for collections: Enable Hoots for a collection to activate them across all analysis resources within the source collection. To control visibility more selectively, create a dedicated collection with Hoots enabled and add only the analysis resources you want to include. This approach allows for more granular management.
Displaying hoots outside source collections: To display Hoots on web pages that are not part of your source collections, enable Hoots for business terms and their subtypes. Add the Hoots URL for each resource and include those resources in a collection that has Hoots enabled. When users visit the configured URL for a business term, the corresponding Hoot appears on that page.
Making hoots available via the browser extension: Hoots can be surfaced through the data.world browser extension for Google Chrome and Microsoft Edge. After installing the extension, users will automatically see Hoots when navigating to supported BI and analysis pages—such as Tableau dashboards or Power BI reports—where Hoots have been configured in data.world.
Important
The data.world Browser Extension is only available for Private instance and Single Tenant instance installations.
Updating hoot status: The status of a Hoot reflects the status of its connected resource in the catalog. When a resource’s status changes, the Hoot status updates automatically, ensuring users always see the most current information about the associated analysis resource.
Types of resources for which hoots are available
Following is a sample list of analysis resources for which hoots are available:
Databricks Notebooks
Domo Page
Looker Dashboard
Looker Look
Tableau Dashboard
Tableau Workbook
QuickSight Analysis
QuickSight Dashboard
Grafana Dashboard
PowerBI App
PowerBI Dashboard
PowerBI Report
Qlik Sense App
Qlik Sense Sheet
Qlik Sense Story
Sigma Workbook
PBIRS PowerBI Report
SSRS Report
ThoughtspotAnswer
ThoughtspotLiveboard
To display Hoots on web pages not associated with analysis resources, enable Hoots for business terms and their subtypes, and configure custom webpage links for them in the External Target URL field.