Getting access to platform metrics through a dataset
Follow the process outlined in this section to get access your metrics.
STEP 1: Getting access to the ddw-metrics resources
Private instance and single tenant instance installations get the ddw-metrics resource tables through a special ddw-metrics dataset in the data-catalog-team organization.
If you don't have access to the dataset or the tables in it, Contact the support team to get the access.
STEP 2: Know your ddw-metrics dataset and project
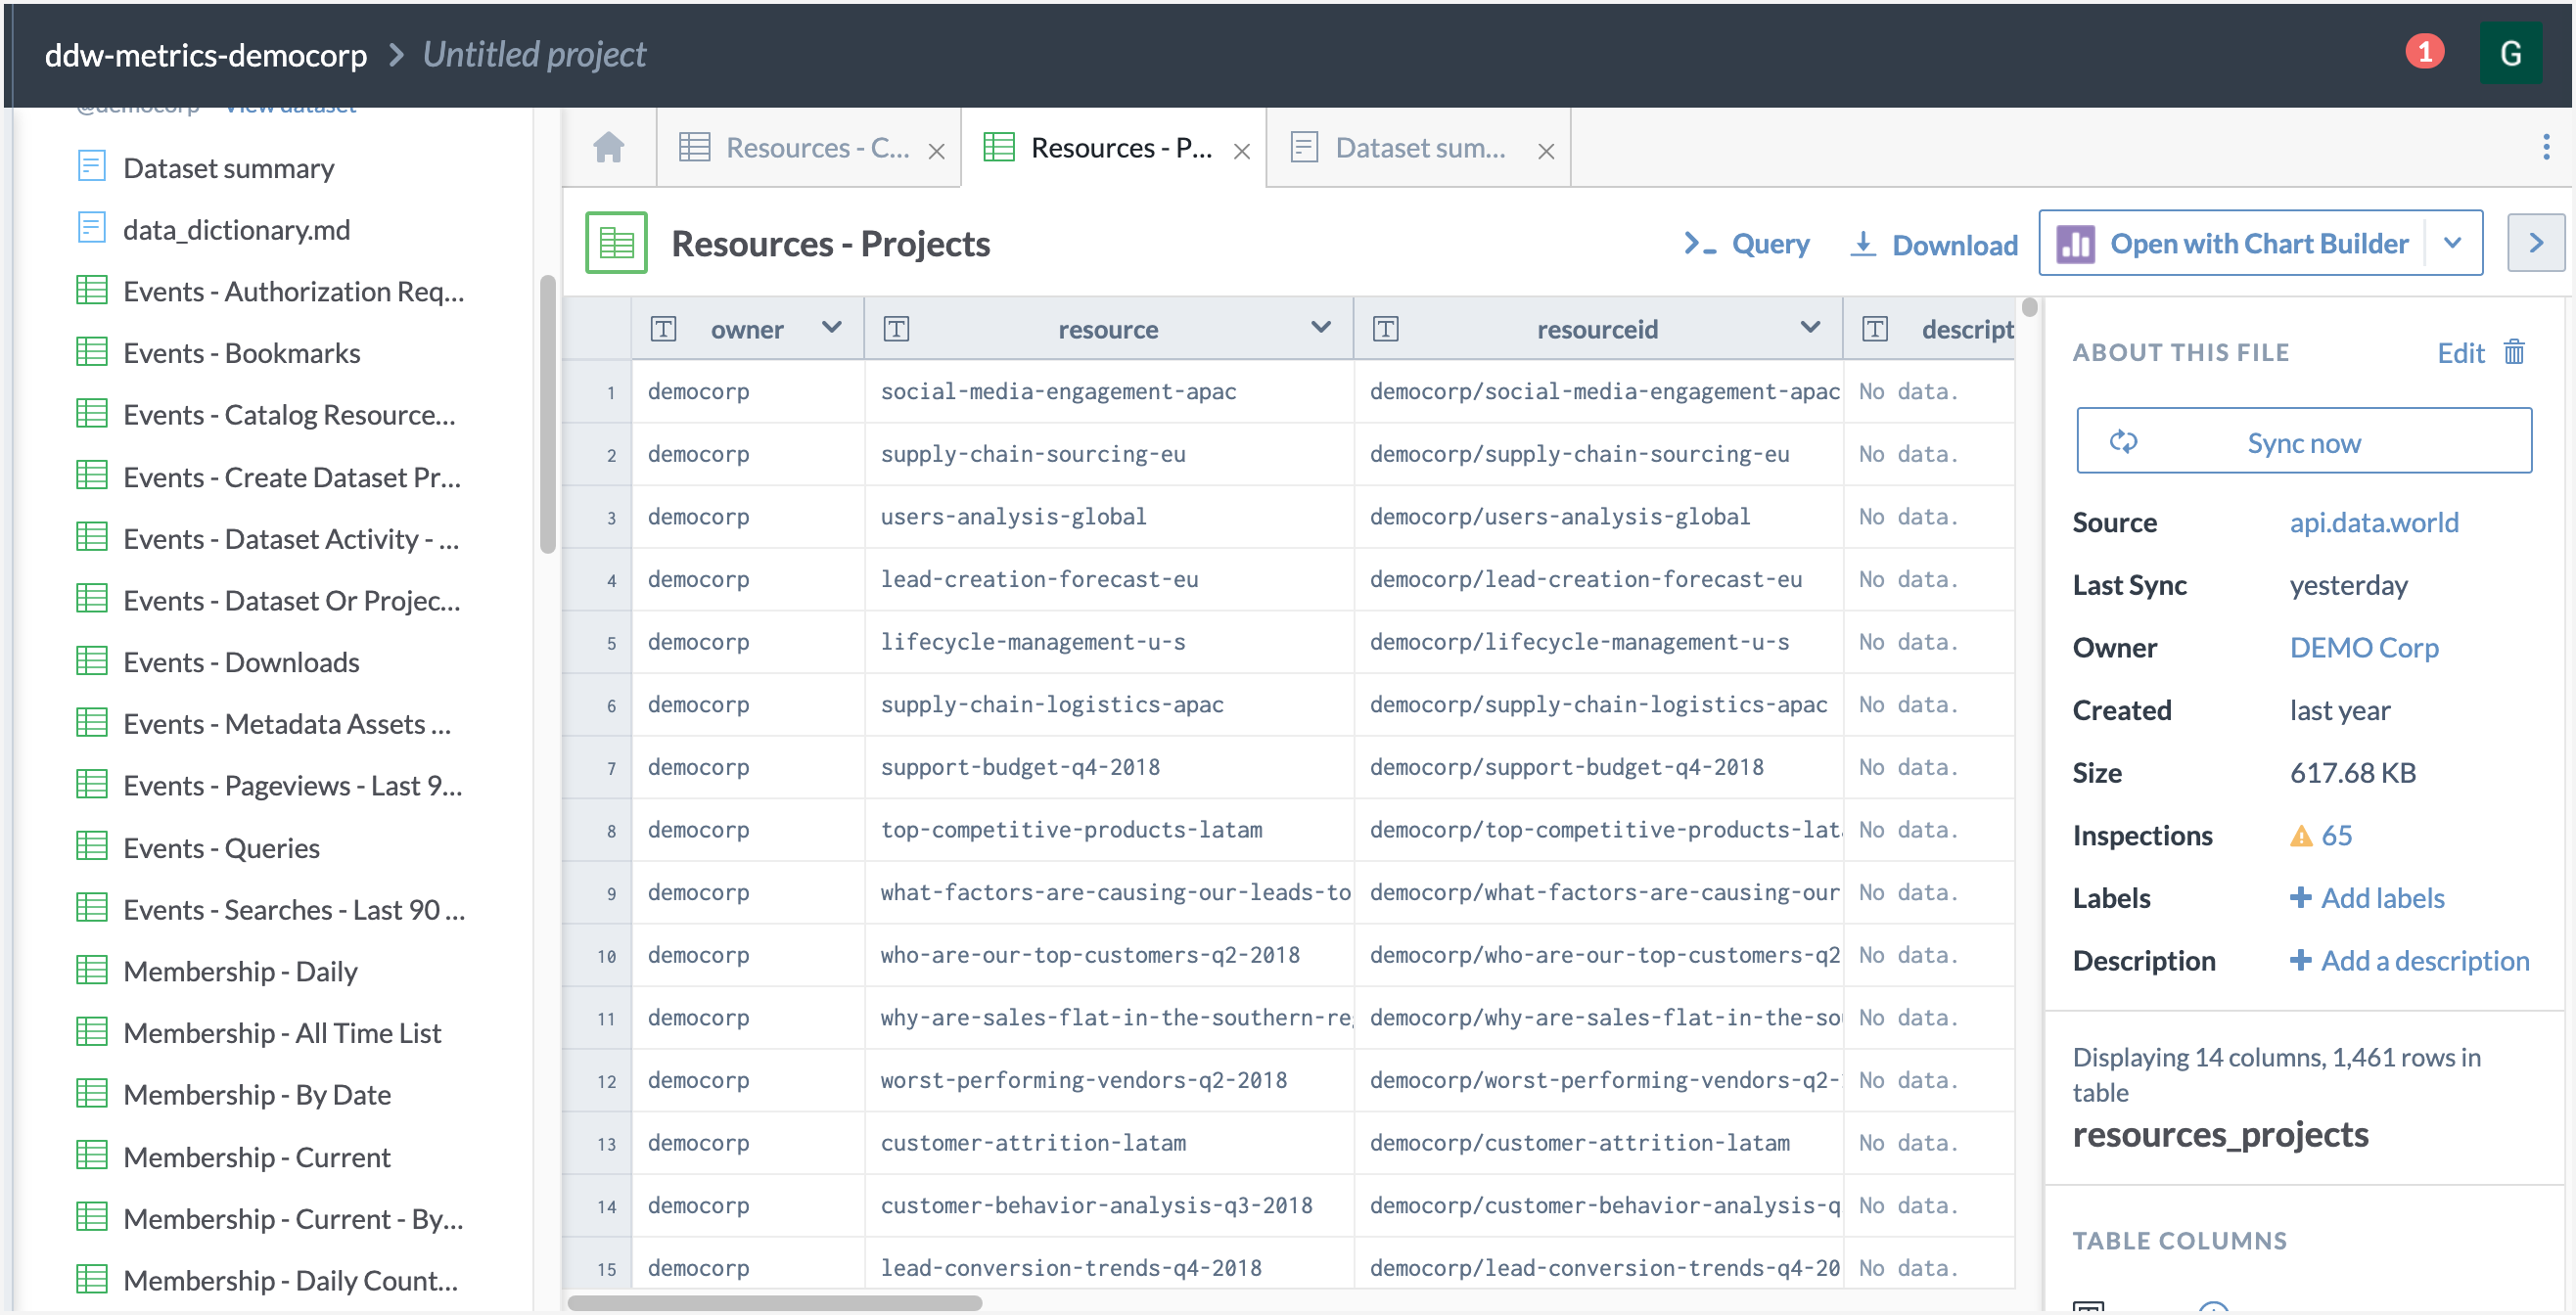
A special metrics dataset - ddw-metrics dataset is available in in the data-catalog-team organization. You can explore it by browsing to the datasets list of the data-catalog-team organization or by searching for it. The dataset name will be: ddw-metrics-<custom_name> for example, ddw-metrics-democorp
Click the Launch the workspace button to see the contents of the dataset.
The Metrics categories available are: Events, Membership, Resources, Tops and Visits. See here for more details on these.
Warning
Restrict the use of the dataset!
This dataset has all the information about how the application is being used by your organization. It is recommended that you share this dataset with limited number of people in your organizations.
This dataset is automatically updated at regular intervals. You should not edit any properties of this dataset and should not add any files in it. Any changes made to the dataset will be overwritten at the next automatic update.
Along with the ddw-metrics-<custom_name> dataset, there is a corresponding ddw-metrics-etl-<custom_name> project available in the data-catalog-team organization. This project stores queries that creates the metrics in the Metrics dataset (ddw-metrics-<custom_name>).
Warning
Restrict the use of the project!
Just like the ddw-metrics-<custom_name> dataset, this project is periodically updated by the system. It should not be edited and should not be shared with wider audience.
STEP 3: Query the metrics to generate insights
Create a project and link the ddw-metrics-<custom_name> dataset with it so you can query it.
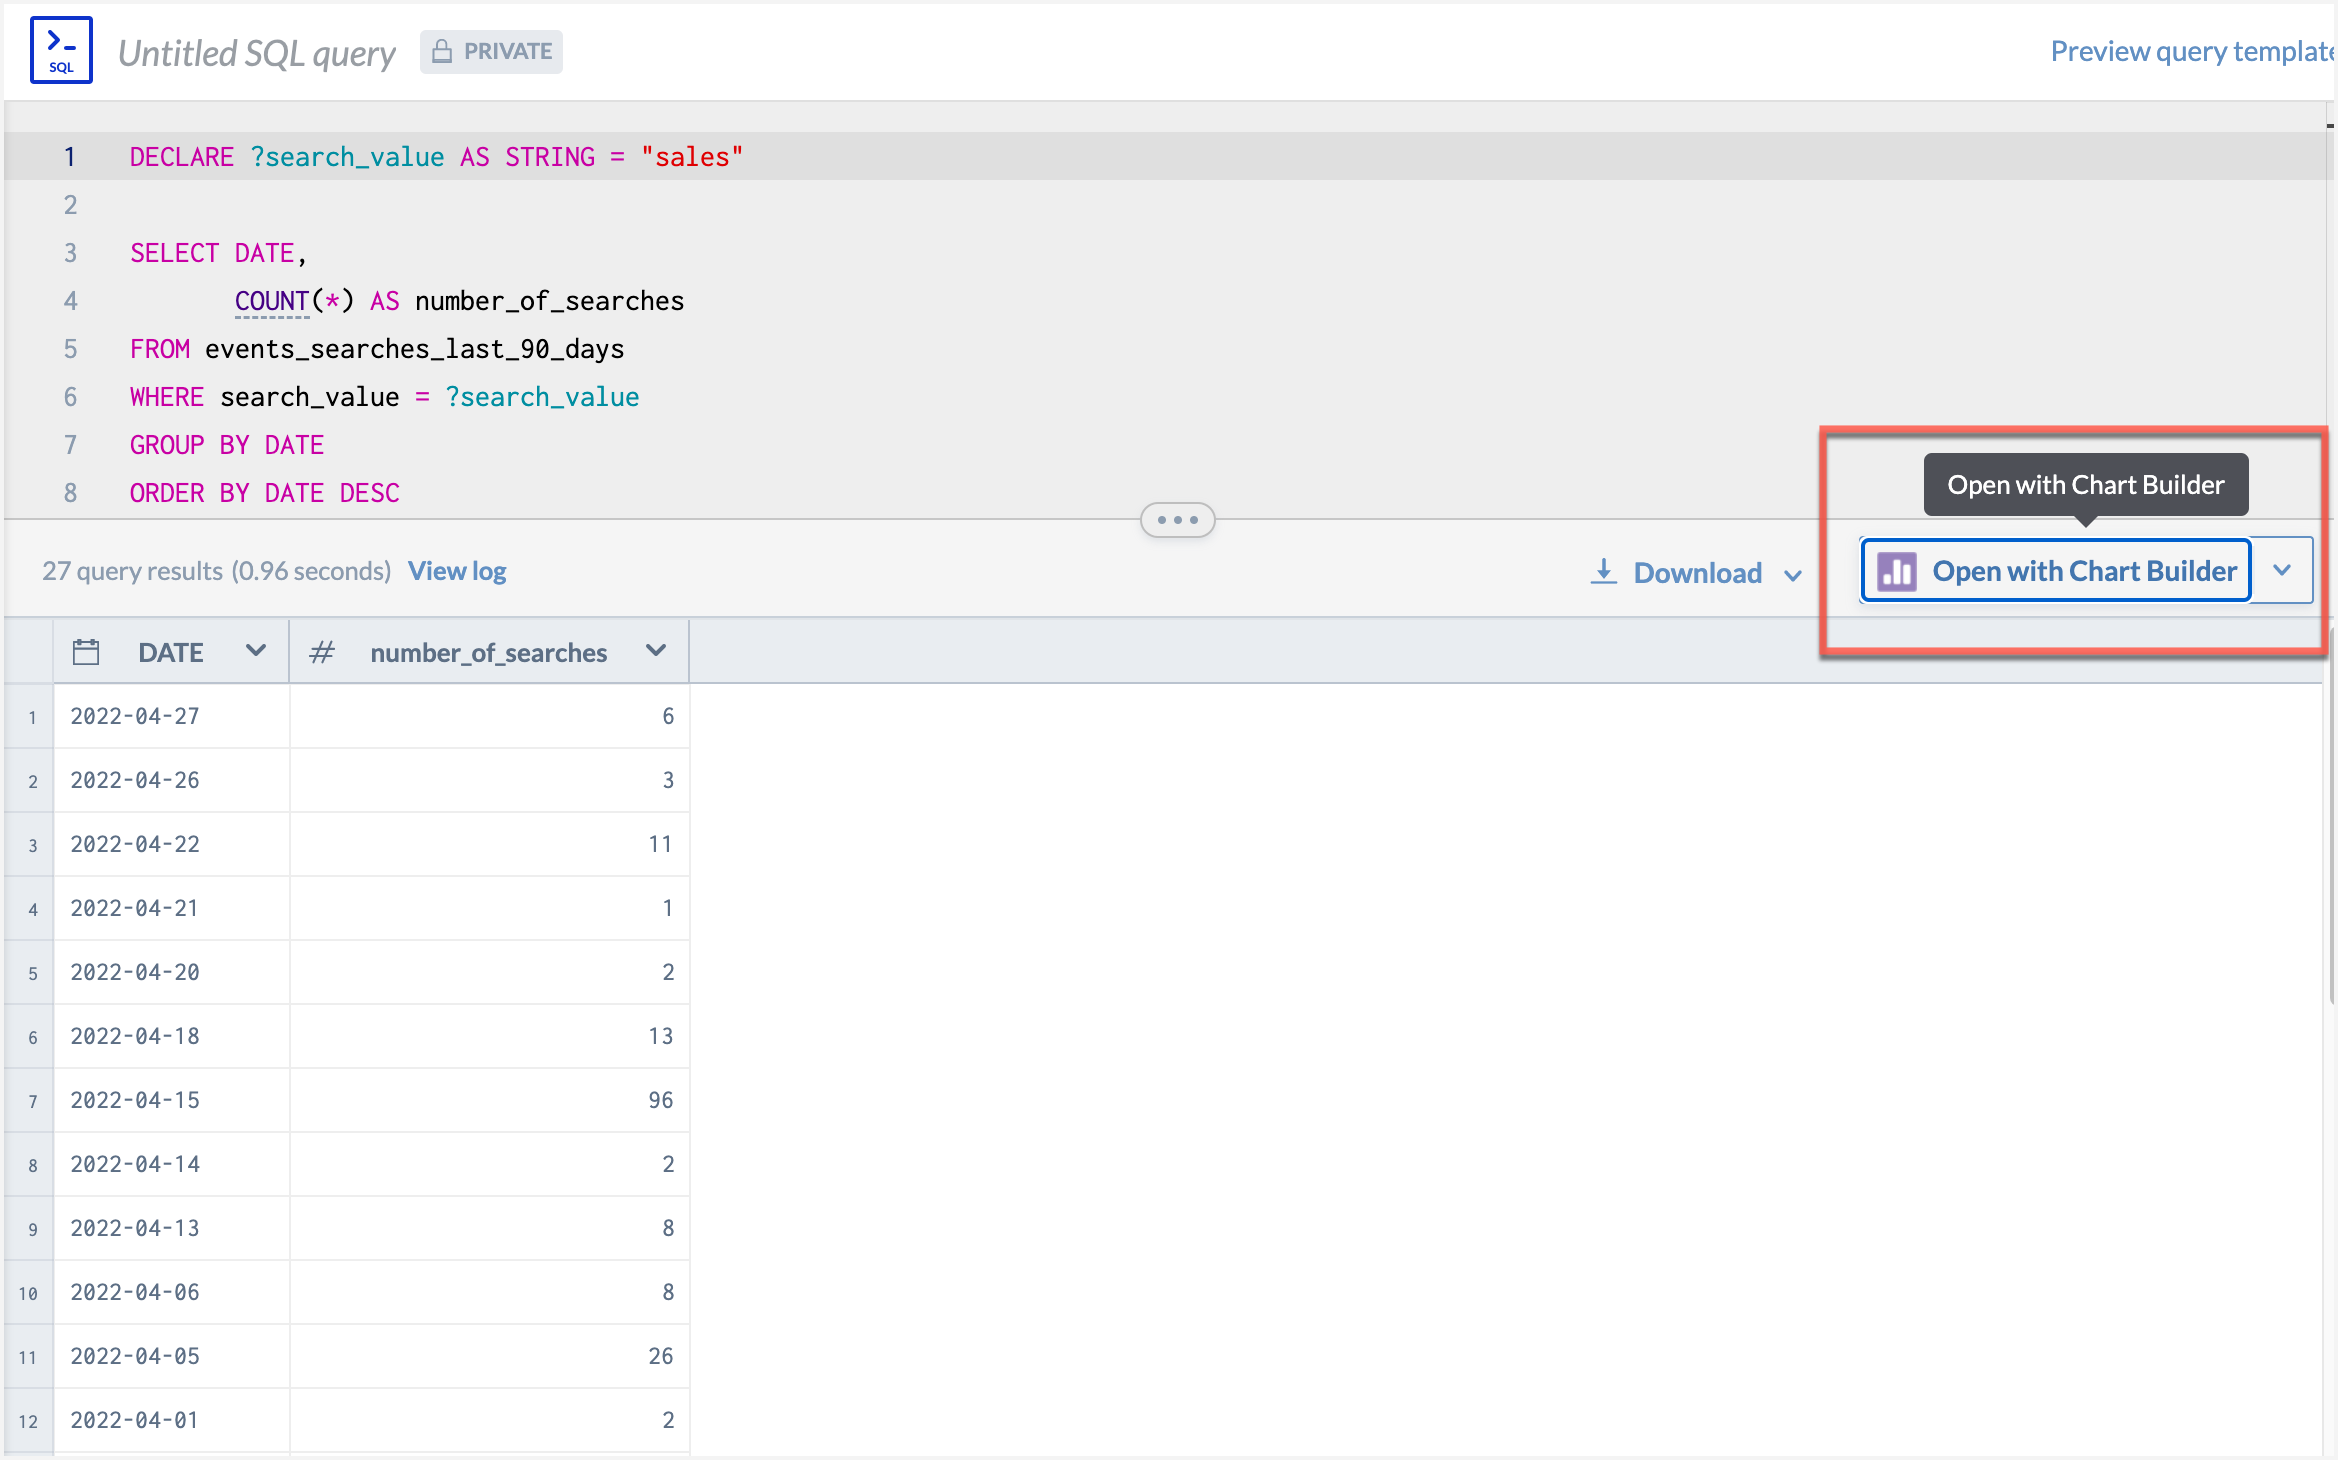
Locate the events_searches_last_90_days table and create a new query to find out how many times a keyword Sales was searched in the last 90 days.
Important
We are using events_searches_last_90_days to just show a sample query of how this is done. You can use any query or table for this exercise.
Replace Sales with a search term that is relevant for your organization.
Sample query
DECLARE ?search_value AS STRING = "sales"

SELECT DATE,
       COUNT(*) AS number_of_searches
FROM events_searches_last_90_days
WHERE search_value = ?search_value
GROUP BY DATE
ORDER BY DATE DESC
LIMIT 90
When you run the query, you will see the results for last 90 days.
Click the Open with Chart Builder (or any other BI tool) to see a graphical representation of the results.
Caution
The Chart Builder tool is available only in organizations in multi-tenant installation.
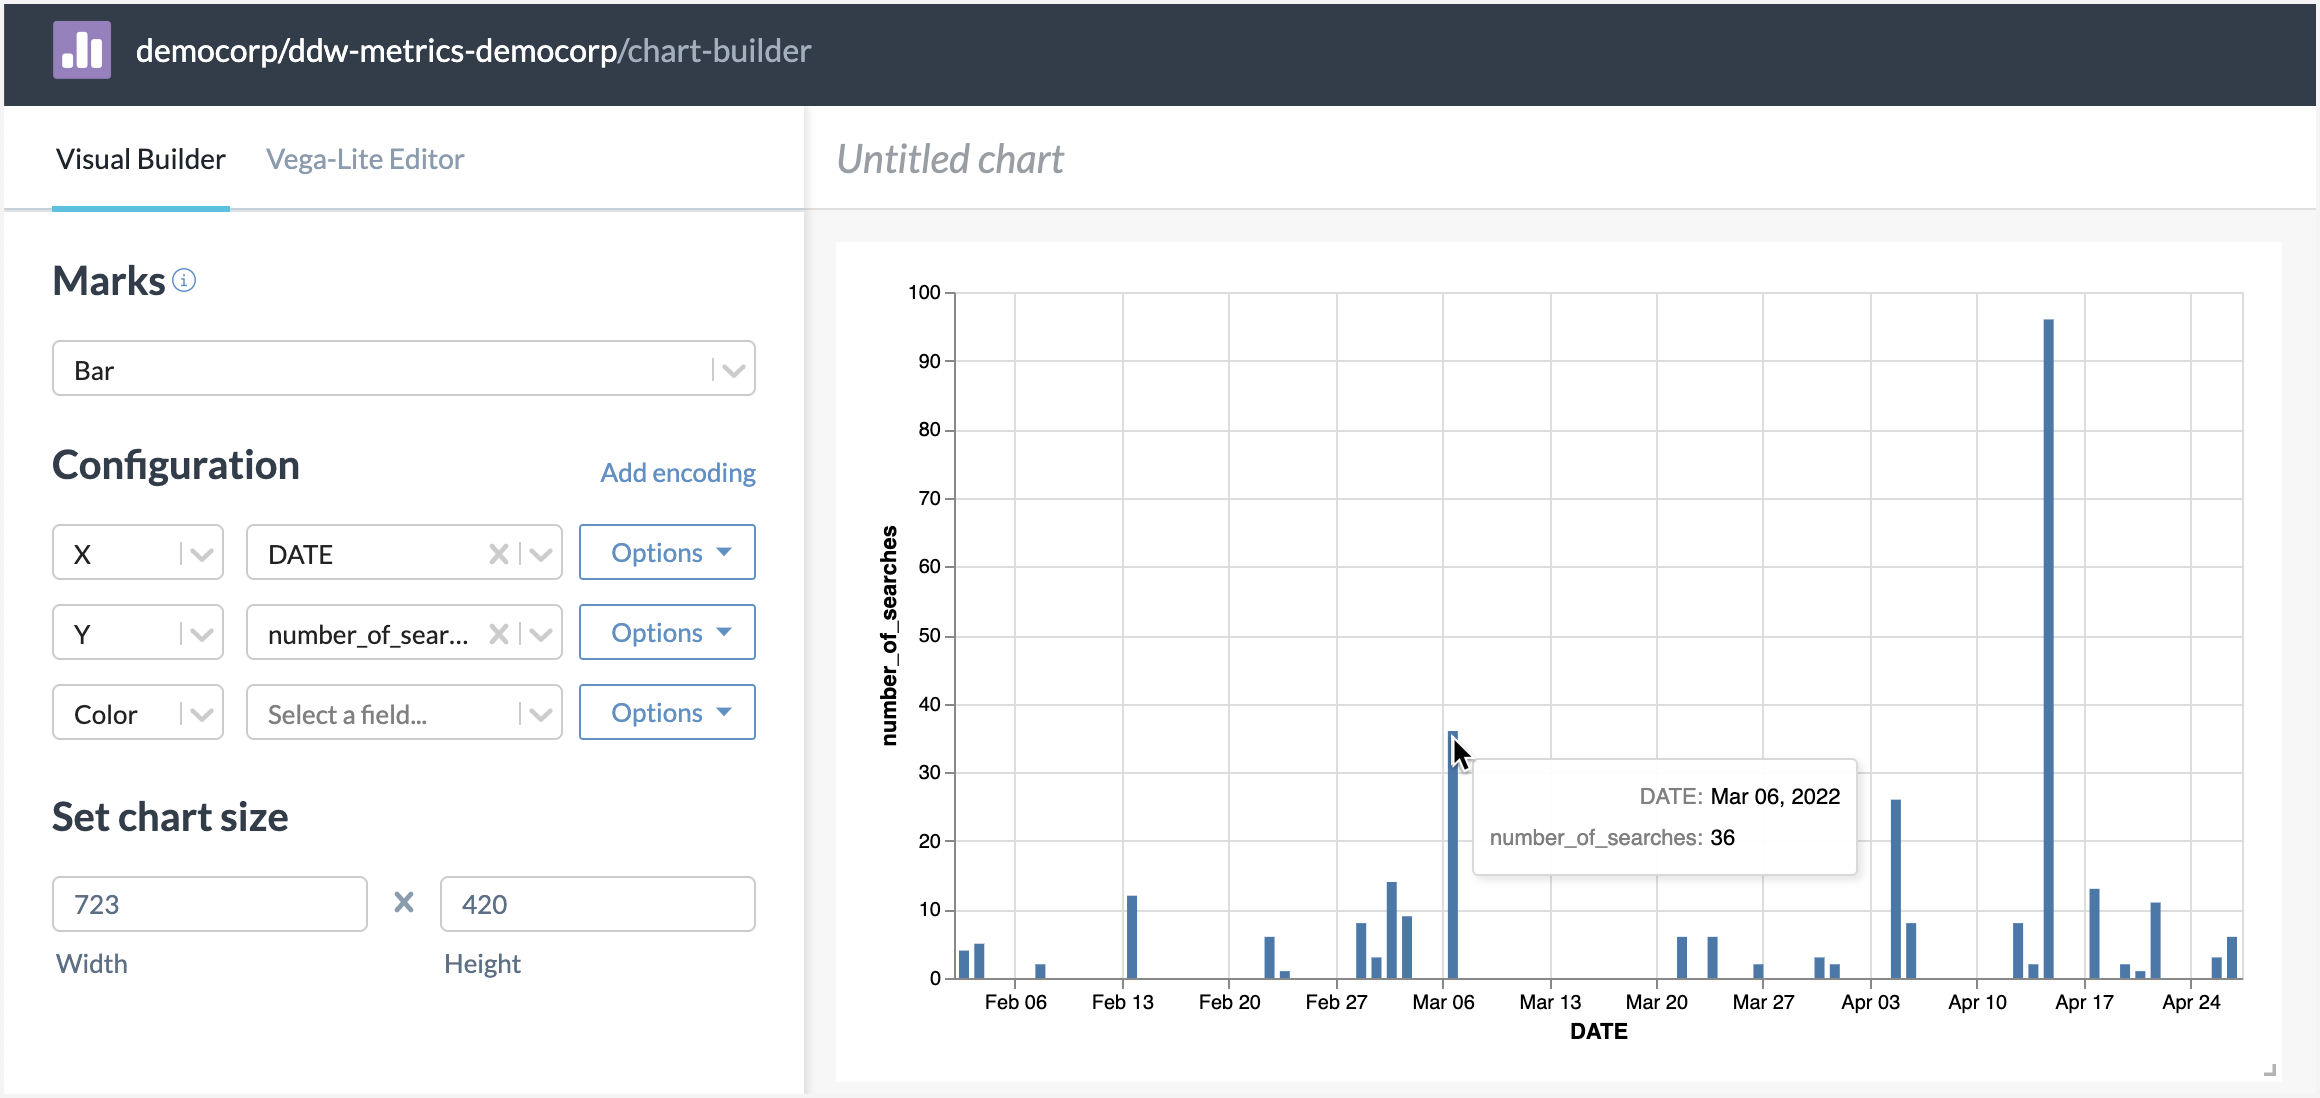
In the Chart Builder tool, set the X and Y axis to see the chart for the data returned by the query.
Note
Pro tip: Generate graphical representation and charts from the data and publish to a shared projects as Insights or other tools so others can consume the information.
View the results!🎉
We just showed you how to open the results in the built-in Chart Builder tool. You can choose to open the results in Tableau, Microsoft Excel, or other tool of your choice to build charts and share insights with your team.
Note
Pro tip: For BI tools, use the Postgres Proxy service to connect directly to the metrics dataset.
Try a few more queries on your own now!
Try running these additional queries to understand the metrics.