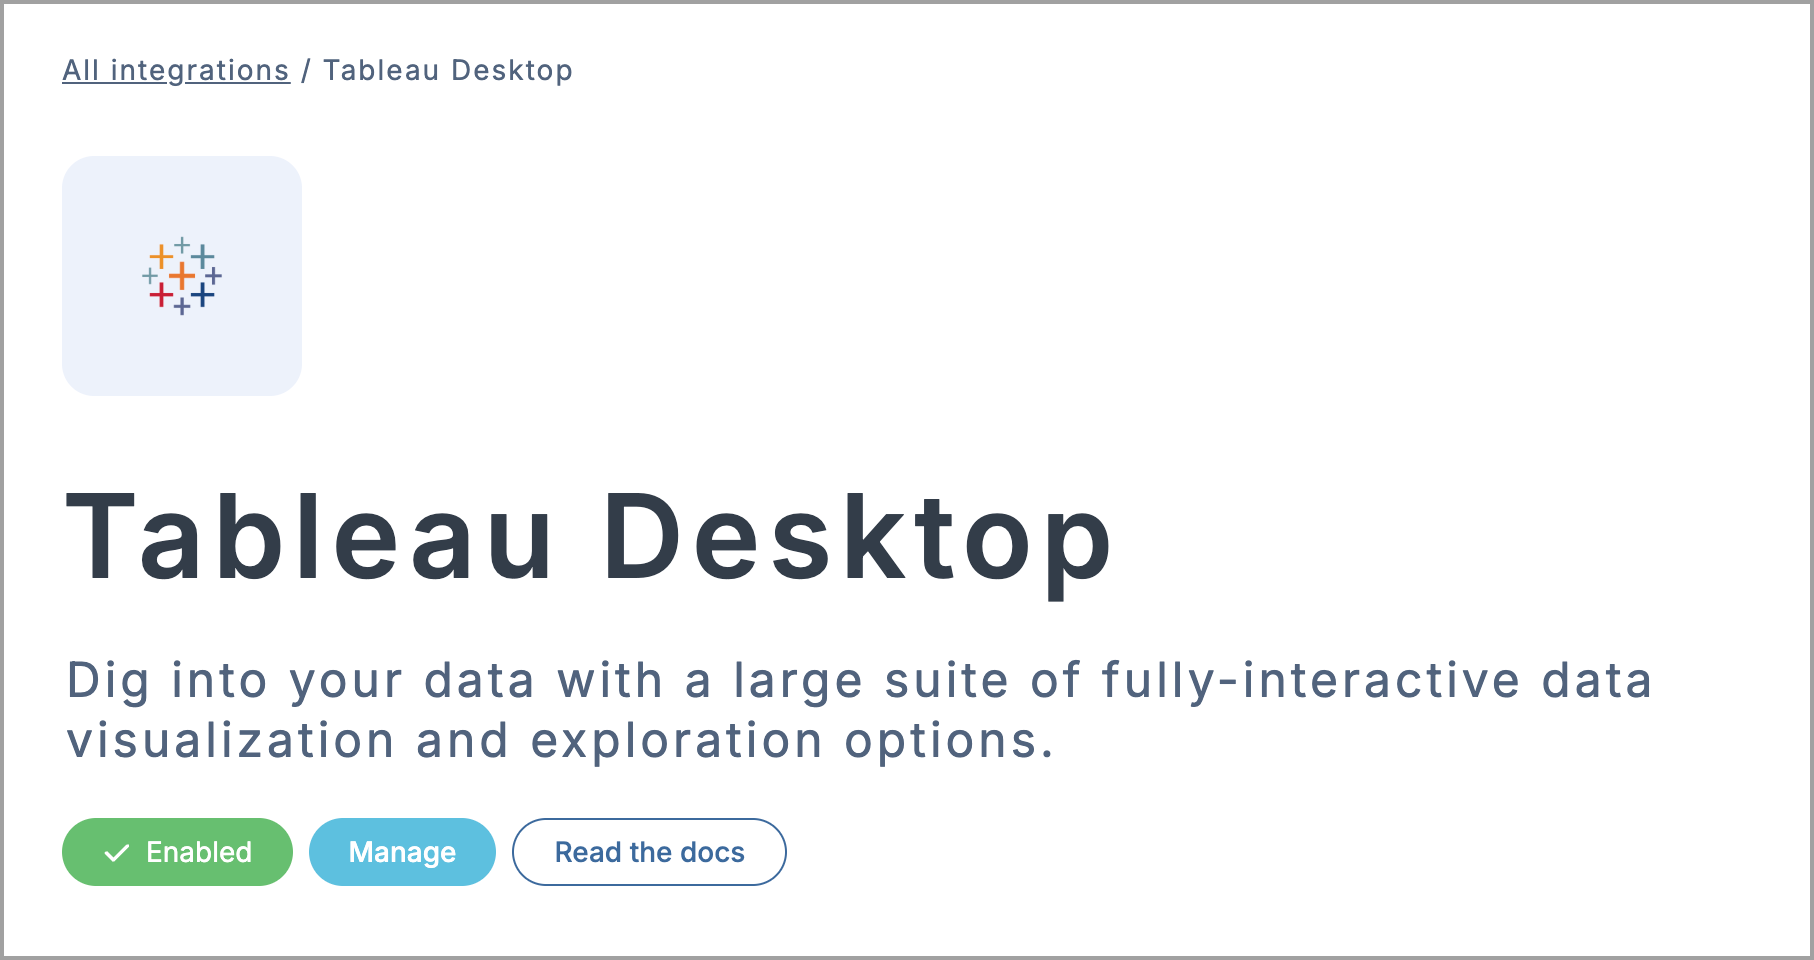
Tableau Desktop Connector
The data.world Tableau Desktop connector helps you create dynamic, customizable visualizations using your datasets. Visualize live query results, blend data from different sources, and share interactive dashboards that stay in sync automatically.
This integration is ideal for analysts, storytellers, and decision-makers who want to bring data to life and keep teams aligned—without manual effort.
Key benefits include:
Live data connection: Connect directly to datasets, files, or query results on data.world, allowing you to work with real-time, trusted data.
Automatic updates: Keep visualizations synced with your data.world source, so dashboards always reflect the latest insights—no manual refreshes needed.
Visual customization tools: Build charts, tables, and scorecards using Tableau intuitive interface—no coding required, making insights accessible to everyone.
Multi-source blending: Combine data from data.world with other platforms to create a single, comprehensive view of your metrics.
Share and collaborate: Publish visualizations back to data.world as Insights, or share public links to help your team stay informed and aligned.
Enabling Tableau Desktop integration
Before using Tableau Desktop with your data, you will need to enable the integration. You can do this either through the Integrations gallery or directly from a dataset.
Enabling the integration from the Integration gallery
To enable the Tableau Desktop integration from the Integration gallery:
Go to the Tableau Desktop integration page on data.world.
Click Enable integration and review the requested permissions.
Click Authorize Tableau to confirm. Once authorized, the integration will be enabled for your account.
You can now launch Tableau Desktop directly from any dataset using the Open in app button.
Enabling the integration from a dataset
To enable Tableau Desktop integration from a dataset:
Open the dataset where you want to use Tableau Desktop.
In the Files section, find your data source and click the Open in app icon.
In the Open in a third-party app window, click Explore more integrations.
From the list, select Tableau Desktop to open the integration page.
Click Enable integration > Authorize Tableau to complete setup. Once authorized, the integration will be enabled for your account.
Click Back to my dataset to return and begin using Tableau via the Open in app button.
Importing data from data.world into Tableau Desktop
After enabling the integration, you can import data directly into Tableau Desktop using the Web Data Connector. Choose whether to bring in a full dataset or focus on a specific file or query.
Importing a specific table or query result
To import a specific table or query result:
Go to the dataset on data.world.
Locate your data source or query result and click Open in app > Tableau Desktop.
In the Get started with Tableau window, copy the Connector URL.
In Tableau Desktop, go to Connect > To a Server > Web Data Connector.
In the Web Data Connector window, paste the Connector URL you copied and press Enter.
When prompted, choose the instance you want to use. If your team uses a different instance, click Another data.world instance? and enter your instance name.
Sign in to data.world using your username or email address and password, then click Sign in.
Review the requested permissions and click Authorize Tableau to confirm access.
In the Add a data source from data.world window, do the following:
Dataset URL: Use the pre-filled URL.
Query Type: Select the query type. Leave as SQL unless working with SPARQL.
Query: Modify the default SQL query (SELECT * FROM tablename) to filter or refine your dataset as needed.
Click Connect to load your data into Tableau. Once connected, all fields will be available for visualization.
Importing entire dataset
To import an entire dataset:
In Tableau Desktop, go to Connect > To a Server > Web Data Connector.
In the Enter your web data connector URL field, enter tableau.data.world and press Enter.
When prompted, choose the instance you want to use. If your team uses a different instance, click Another data.world instance? and enter your instance name.
Sign in to data.world using your username or email address and password, then click Sign in.
Review the requested permissions and click Authorize Tableau to confirm access.
In the Add a data source from data.world window, do one of the following:
In the Dataset URL field, enter the URL of the dataset you want to import.
Or click Browse to search and select datasets. Note: Search results are limited to 30. Once selected, the dataset URL will be automatically filled in.
Click Connect to import the dataset. All available tables will be available for visualization.
Preparing your data source before building a visualization
Use the Data Source tab in Tableau Desktop to define the structure of your data. Drag in tables, set relationships, and prepare your dataset before moving on to visual analysis.
To set up your data model in Tableau:
In Tableau Desktop, from the Data Source tab, drag one or more tables onto the Create a data model canvas.
If using multiple tables, define their relationships—choose the join type and matching fields.
Once your data model is ready, click the Sheet 1 tab to begin creating your visualization.
Tip
You can rename sheets and add more to support multiple charts or dashboards.
Creating a visualization from connected data
Start building your visualizations by choosing how to display your data. Drag in fields, apply filters, and customize the layout to uncover patterns, trends, and insights that matter.
To create a visualization in Tableau:
In Tableau Desktop, go to the Data pane to view your dataset fields.
To start visualizing data, drag a field from the Data pane onto the Rows or Columns shelf to generate a basic chart. Tableau will automatically choose a recommended chart type.
Use the Show Me panel to explore and switch between chart types—such as bar charts, line graphs, maps, and scatter plots—to create the most meaningful visualization of your data.
Drag fields to Filters, Color, Label, or Tooltip to add detail and interactivity.
Use the top menu for advanced features:
Dashboard: Combine multiple charts into a single view.
Story: Build a narrative from visual steps.
Analysis: Add trend lines, averages, forecasts, or reference bands.
Click the Tab name at the bottom to rename your worksheet.
Continue adjusting layout, formatting, and interactivity using the options in the toolbar and side panels.
Adding additional data sources to your visualization
Tableau Desktop allows you to combine data from multiple sources in a single visualization. You can add more datasets from data.world or connect to other platforms to enrich your analysis and build more comprehensive dashboards.
To add more data to your workbook:
Click the New Data Source icon in the top toolbar.
Follow the same steps to import data from data.world, or connect to other sources as needed.
Sharing visualizations with your team
After building your visualization, you can publish it and share it with your team or broader audience—whether you want to present insights, support discussions, or keep stakeholders informed. Posting your Tableau visualizations in data.world helps centralize knowledge and connect analysis directly to your data projects.
There are two primary ways to share Tableau visualizations, depending on how and where you want to share them:
Tableau Public: A public sharing platform that lets you publish dashboards to a URL anyone can access.
Tableau Server or Tableau Cloud: A private, secure environment for sharing dashboards inside your organization. Supports Web Data Connectors and scheduled data refreshes to keep reports up to date.
Publishing a visualization to Tableau Public
Use Tableau Public to make your visualization available through a public URL, which you can embed or share directly in data.world.
To publish and share via Tableau Public:
In Tableau Desktop, go to Server > Tableau Public > Save to Tableau Public As.
If you are not already signed in, you will be prompted to log into your Tableau Public account.
Name your visualization and click Save. Your browser will open the published report.
Click the Share button on Tableau Public and then Copy link to get the public URL.
Share the public URL link with your team or embed it in your project insights and discussions using Markdown syntax: @(https://public.tableau.com/shared/url).
Publishing a visualization to Tableau Server
Use Tableau Server or Tableau Cloud when you need to keep dashboards private and securely share within your organization.
To publish and enable refresh support via Tableau Server:
Publish your workbook to Tableau Server. For more details, see the Simple steps to publish a Tableau workbook page.
To enable scheduled refreshes for dashboards connected to data.world, add data.world to your Tableau Server allowlist. Run the following commands on Tableau Server 2018.1 and above:
tsm data-access web-data-connectors add --name 'DW WDC' --url https://tableau.data.world:443 --secondary https://api.data.world/*,https://query.data.world/*,https://data.world/oauth/*
tsm data-access web-data-connectors allow
tsm restart
For more information, visit Tableau WDC documentation, or contact the support team if you need assistance.
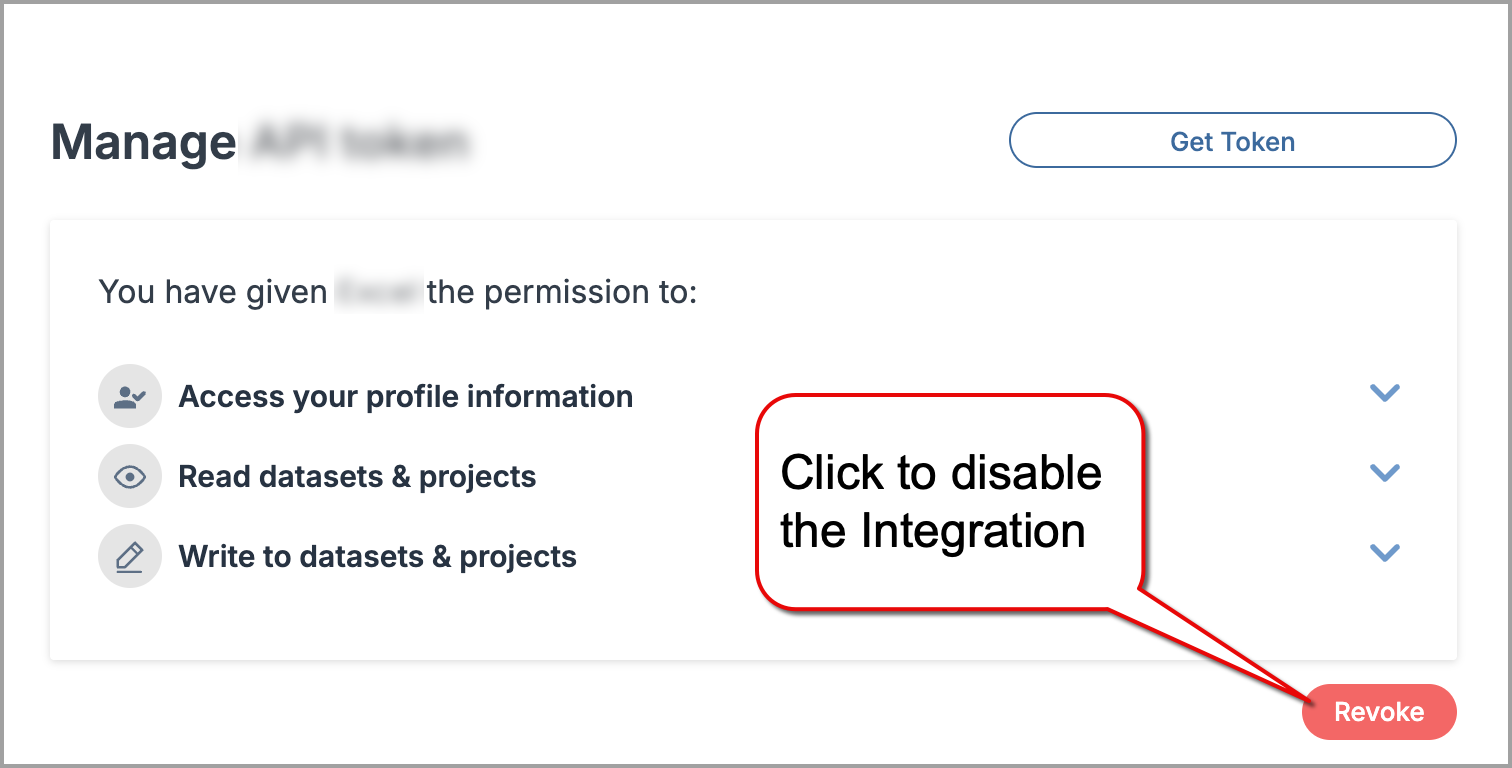
Disabling the integration
Disabling the integration will revoke the application access to your data.world account, datasets and projects data.
Important
To use the integration again, you will need to reconnect and reauthorize access.
To disable an integration:
Go to the integration page.
On the integration page, click the Manage button.
In the Manage section, click Revoke and confirm disconnecting the integration.