Power BI
The data.world integration with Power BI helps you create impactful, interactive reports powered by live, trusted data. Use SQL queries to shape your dataset, apply transformations in the Power BI editor, and build visuals that help teams explore, analyze, and share insights effortlessly.
This integration is ideal for analysts, storytellers, and decision-makers who want to bring data to life and keep teams aligned—without manual effort.
Key benefits include:
Live data connection: Connect directly to datasets on data.world, allowing you to work with real-time, trusted data.
Preview your dataset: Instantly see your data before loading it, helping you validate structure and quality from the start.
Customize reports for impact: Create charts, tables, and scorecards using Power BI intuitive editing tools—no coding required.
Automatic updates: Sync your reports with live data from data.world, enabling scheduled refreshes and reducing the risk of stale dashboards.
Share and collaborate: Publish visualizations back to data.world as Insights, or share public report links to keep your team informed and aligned.

Enabling Power BI integration
Before using Power BI with your data, you will need to enable the integration. Whether you start from the Integrations gallery or directly from a dataset, both flows will guide you through connecting your account and unlocking visualization features.
Enabling the integration from the Integration gallery
To enable the Power BI integration from the Integration gallery:
Go to the Power BI integration page on data.world.
Click Enable integration and review the requested permissions.
Click Authorize Power BI to confirm. Once authorized, the integration will be enabled for your account.
You can now launch Power BI directly from any dataset or project using the Open in app button.
Enabling the integration from a dataset
To enable Power BI integration from a dataset:
Open the dataset where you want to use Power BI.
In the Files section, find your data source and click the Open in app icon.
In the Open in a third-party app window, click Explore more integrations.
From the list, select Power BI to open the integration page.
Click Enable integration > Authorize Power BI to complete setup. Once authorized, the integration will be enabled for your account.
Click Back to my dataset to return and begin using Power BI via the Open in app button.
Importing data from data.world into Power BI
After enabling the integration, you can import data into Power BI directly from a data.world dataset. Use SQL queries to select the exact data you want to visualize in a live, interactive report.
To import data from data.world into Power BI:
In Power BI Desktop, go to Home > Get data from other sources.
In the Get Data window, find Data.World – Get Dataset and click Connect, then Continue. The DataWorld.Dataset window opens.
Go to the dataset on data.world that you want to use.
In the Files section, locate your data source and click the Open in app icon > Power BI. The Get started with Power BI window opens, showing the values needed for connection.
Go back to Power BI Desktop. In the DataWorld.Dataset window, fill in the following fields and click OK:
Owner: The unique identifier of the dataset creator. For example, initech.
Dataset ID: The unique dataset identifier. For example, customer-order-history.
Query (optional): Enter a SQL query to filter and refine the data. Leave blank to load all tables from the dataset. For example, SELECT * FROM customer_order_history.
On the next screen, choose a sign-in method:
To sign in with your credentials:
In the left pane, select OAuth v2 and click Sign In.
Enter your username or email address and password, then click Sign in.
Review the requested permissions and click Authorize Power BI to confirm access.
To sign in with an access token:
In the left pane, select API Token.
Paste your token into the Account key field.
To get your token, go to the Advanced settings page on data.world, and copy it from the API Tokens section.
Click Connect. In the preview screen, choose how to bring your data:
Click Load to import the data as is.
Click Transform Data to refine your dataset before building your report.
Preparing your data source before building a visualization
Note
You only need this step if you chose Transform Data during the import process. If you clicked Load, you can skip to report creation.
Transforming your data allows you to clean, filter, or reshape it before using it in your Power BI visualizations. This is helpful if you want to remove unnecessary fields, join tables, group rows, or rename items for clarity.
To transform your data in Power BI:
In Power BI Desktop, after clicking Transform Data, the query editor opens with a preview of your dataset.
Use the editor tools to make changes such as:
Remove rows or columns
Merge or group data
Rename fields or queries
When finished, click the Close & Apply button in the upper-left corner to load the refined data and begin creating your visualizations.
Creating a report from connected data
After connecting your data from data.world, Power BI opens a blank report canvas. From here, you can start building charts, customizing visuals, and combining fields to tell a clear story with your data.
To create a report:
In Power BI Desktop, go to the Data pane to view your dataset fields.
To start visualizing data, drag a field from the Data pane onto the canvas to create a new chart. Power BI will automatically choose a recommended chart type.
Use the Visualizations pane to switch chart types—such as bar charts, line graphs, maps, and scatter plots—to create the most meaningful visualization of your data.
Drag additional fields into the Values, Axis, Legend, or Filters areas to shape and refine your chart.
Use the Insert tab to add:
Charts (tables, scorecards, time series, and more)
Text boxes for notes, titles, or explanations.
Images or logos to brand your report.
Use the Filters pane to make your report interactive, or add multiple visuals to compare metrics across dimensions.
Click the Page tab name at the bottom to rename your worksheet.
Continue adjusting layout, formatting, and interactivity using the toolbar and side panels. Add more pages as needed to organize your dashboard.
Sharing reports with your team
After building your report in Power BI, you can publish and share it with others—whether you are presenting findings, supporting decision-making, or keeping stakeholders aligned. Sharing your Power BI report from data.world helps bring your analysis full-circle, connecting raw data to final insights.
To share your report:
In Power BI Desktop, go to File > Publish > Publish to Power BI. The Save this file window opens.
Name your file and click Save.
When prompted, enter your Power BI account email address, then click Continue > Save.
In the Publish to Power BI window, choose your destination workspace (for example, My workspace). Once the report is published, click Open report in Power BI to view it in your browser.
From the top menu in Power BI Service, choose how to share your report:
Share: Invite users directly by email, assign view or edit access, and control permissions. Ideal for secure collaboration across your team. Learn more in Microsoft sharing guide.
Note: This feature requires a Power BI premium license.
Embed: Go to File > Embed report > Publish to web (public) to generate an iframe code. You can embed the live report in data.world using Markdown syntax.
Note: Public embeds are visible to anyone with the link—best for open data or community use only.
Export: From the dropdown menu, choose PDF to create a static version of your report. Great for email updates or attaching in data.world discussions.
Keeping your data up to date
Publishing your report to the Power BI Service allows you to configure a scheduled refresh, keeping your data current without manual updates. This helps ensure your dashboards always reflect the latest insights.
For details on setting up refresh, see the Microsoft configure scheduled refresh guide.
Disabling the integration
Disabling the integration will revoke the application access to your data.world account, datasets and projects data.
Important
To use the integration again, you will need to reconnect and reauthorize access.
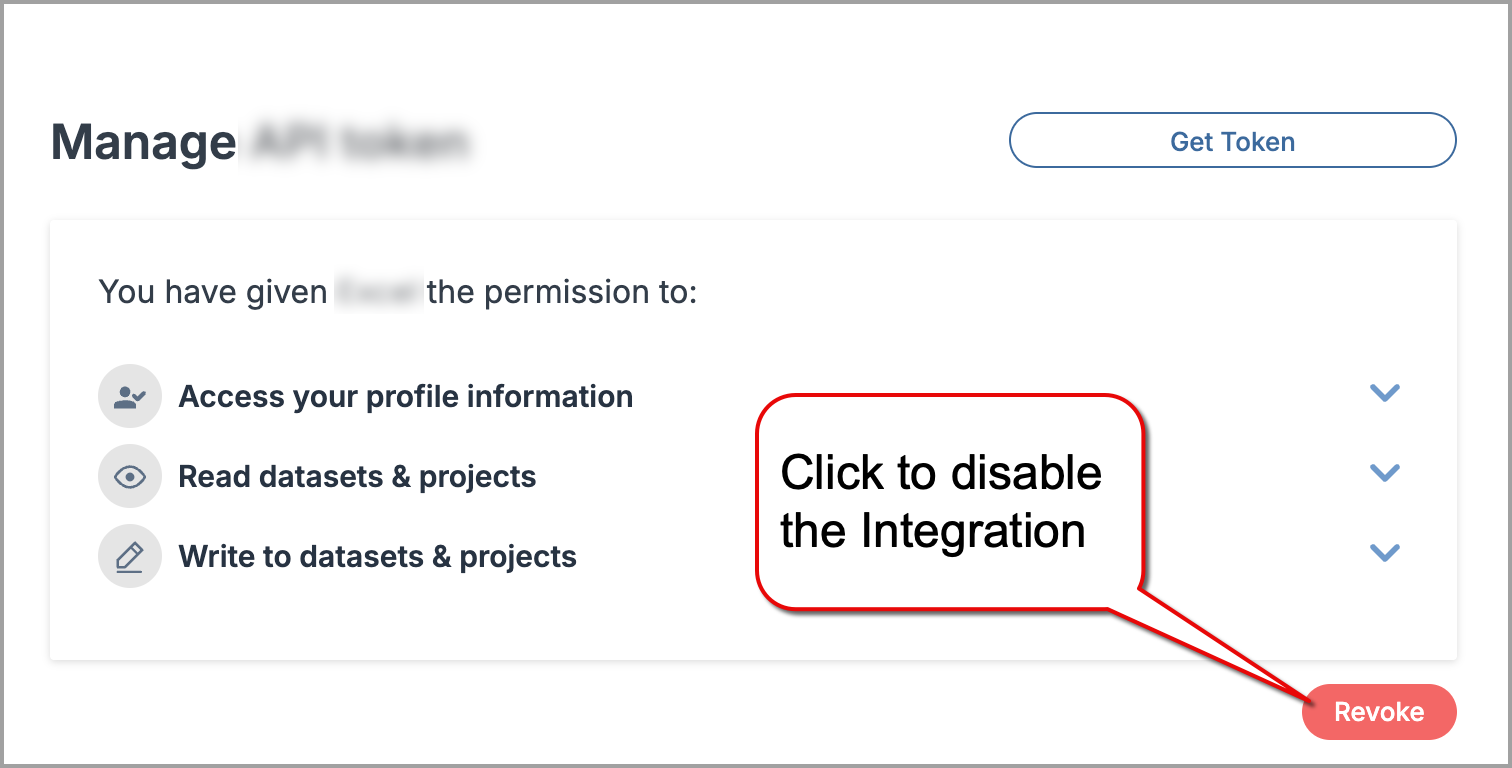
To disable an integration:
Go to the integration page.
On the integration page, click the Manage button.
In the Manage section, click Revoke and confirm disconnecting the integration.