Viewing platform usage analysis
The Data Catalog Team organization in data.world features a special DDW Platform Analysis project and Platform Use Analysis dataset that offer analysis and visualizations for the following metrics:
Important
If the platform usage analysis dataset and project are not included in your organization on data.world, please contact your Customer Success Director at data.world for activation.
Customer Real Active Days: Captures the total number of Real active days for each week in the past 12 weeks, grouped by the starting date of each week, and presents the results in descending order based on the start dates.
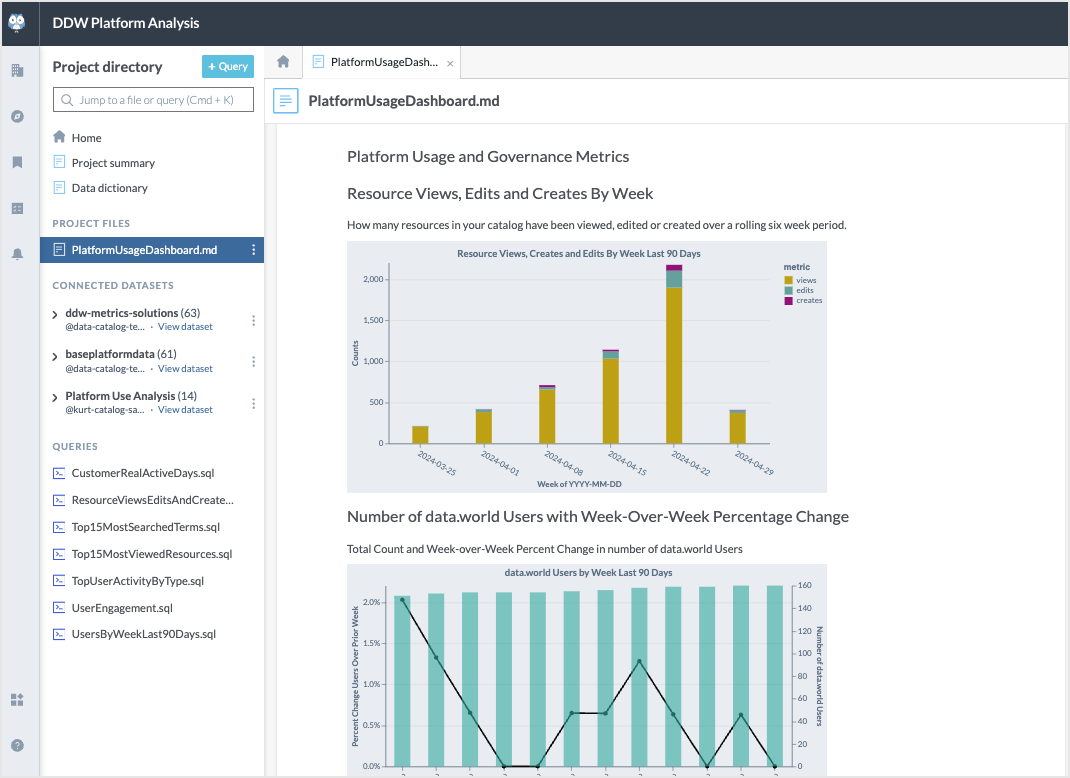
Resource view, edit, and create: Captures the views, edits, suggestions, and deletions of catalog resource pages made by users each week.
Top 15 Most Searched Terms: Provides a ranked list of the most frequently searched terms along with the number of occurrences.
Top 15 Most Viewed Resources: Provides a list of resources, ranked by the frequency of views.
Top user activity by type: Captures a list of top 15 users who have created, edited, and viewed resources in the catalog.
Users by week: Lists and visualizes the weekly changes and percentage changes in the number of provisioned users a given time-span.
User engagement: Lists the various user activity metrics in data.world, including CRADs, first and last visit dates, average days between visits, number of searches, and total page views.
Important
The data in these charts is updated every 24 hours.
To view the usage analysis for the platform:
In the Data Catalog Team organization, browse to the DDW Platform Analysis project.
On the Overview tab, click the Launch Workspace button. In the Project directory, browse to PlatformUsageDashboard.md to view the complete set of visualizations derived from the metrics data available in the application. The data in these visualizations is updated every 24 hours.
To view the queries used to generate the visualizations, browse to the list of Queries in the Project directory. Open the specific query to view the details for it.
Next, browse to the Platform Use Analysis dataset.
On the Overview tab, view the Insights derived from the metrics data available in the application. Along with the insights you are presented with a tabular view of the data for each insight. Click the See all button to view complete details of the results. The data in these visualizations and tables is updated every 24 hours.