Viewing users dashboards
Users Dashboards provide insights into user provisioning, activity trends, and deactivation data on data.world.
Use these dashboards to:
Monitor user activity at different time intervals, helping track engagement trends over time.
Track total provisioned users and their historical trends, providing insights into user adoption and growth.
Identify deactivated users and analyze account lifecycle data, supporting retention and reactivation strategies.
Key users dashboards
Explore the following dashboards with key metrics available on the Users dashboard page.
User metrics
This section helps monitor overall user statistics, providing insights into platform adoption and retention trends.
Dashboard | Description | Source for the dashboards |
|---|---|---|
Total Instance Users/Accounts | All user and service accounts within this data.world instance. Includes provisioned, activated, not-activated, deactivated, service, and support accounts. | Sourced from tables:
|
Provisioned Users | Users who have been granted access to the platform. Excludes deactivated users, service accounts, and support users. | |
Service accounts | Non-human accounts created for automated or programmatic access to the platform. | |
Deactivated users | Users whose accounts have been deactivated. | |
Support Users | data.world employee accounts provisioned for customer support and collaboration. | |
Activated Users | Provisioned users who have signed in to the platform at least once. | |
Non activated users | Provisioned users who have not yet signed in to the platform. | |
Full users | Provisioned users with write or admin access to at least one resource in the platform. | |
Read-only users | Provisioned users whose highest level of access across the platform is read-only. | |
User activity | ||
Daily Active Users | Shows the number of users who were active on a given calendar date, helping to measure daily engagement. | Sourced from tables:
|
Weekly Active Users | Tracks user activity over the last 7 full days (excluding the current day), showing percentage change from the previous week, which helps identify trends in user retention. | |
Monthly Active Users | Displays the number of users active in the last 28 full days (does not include the current day), with a comparison to the previous month, supporting long-term engagement analysis. | |

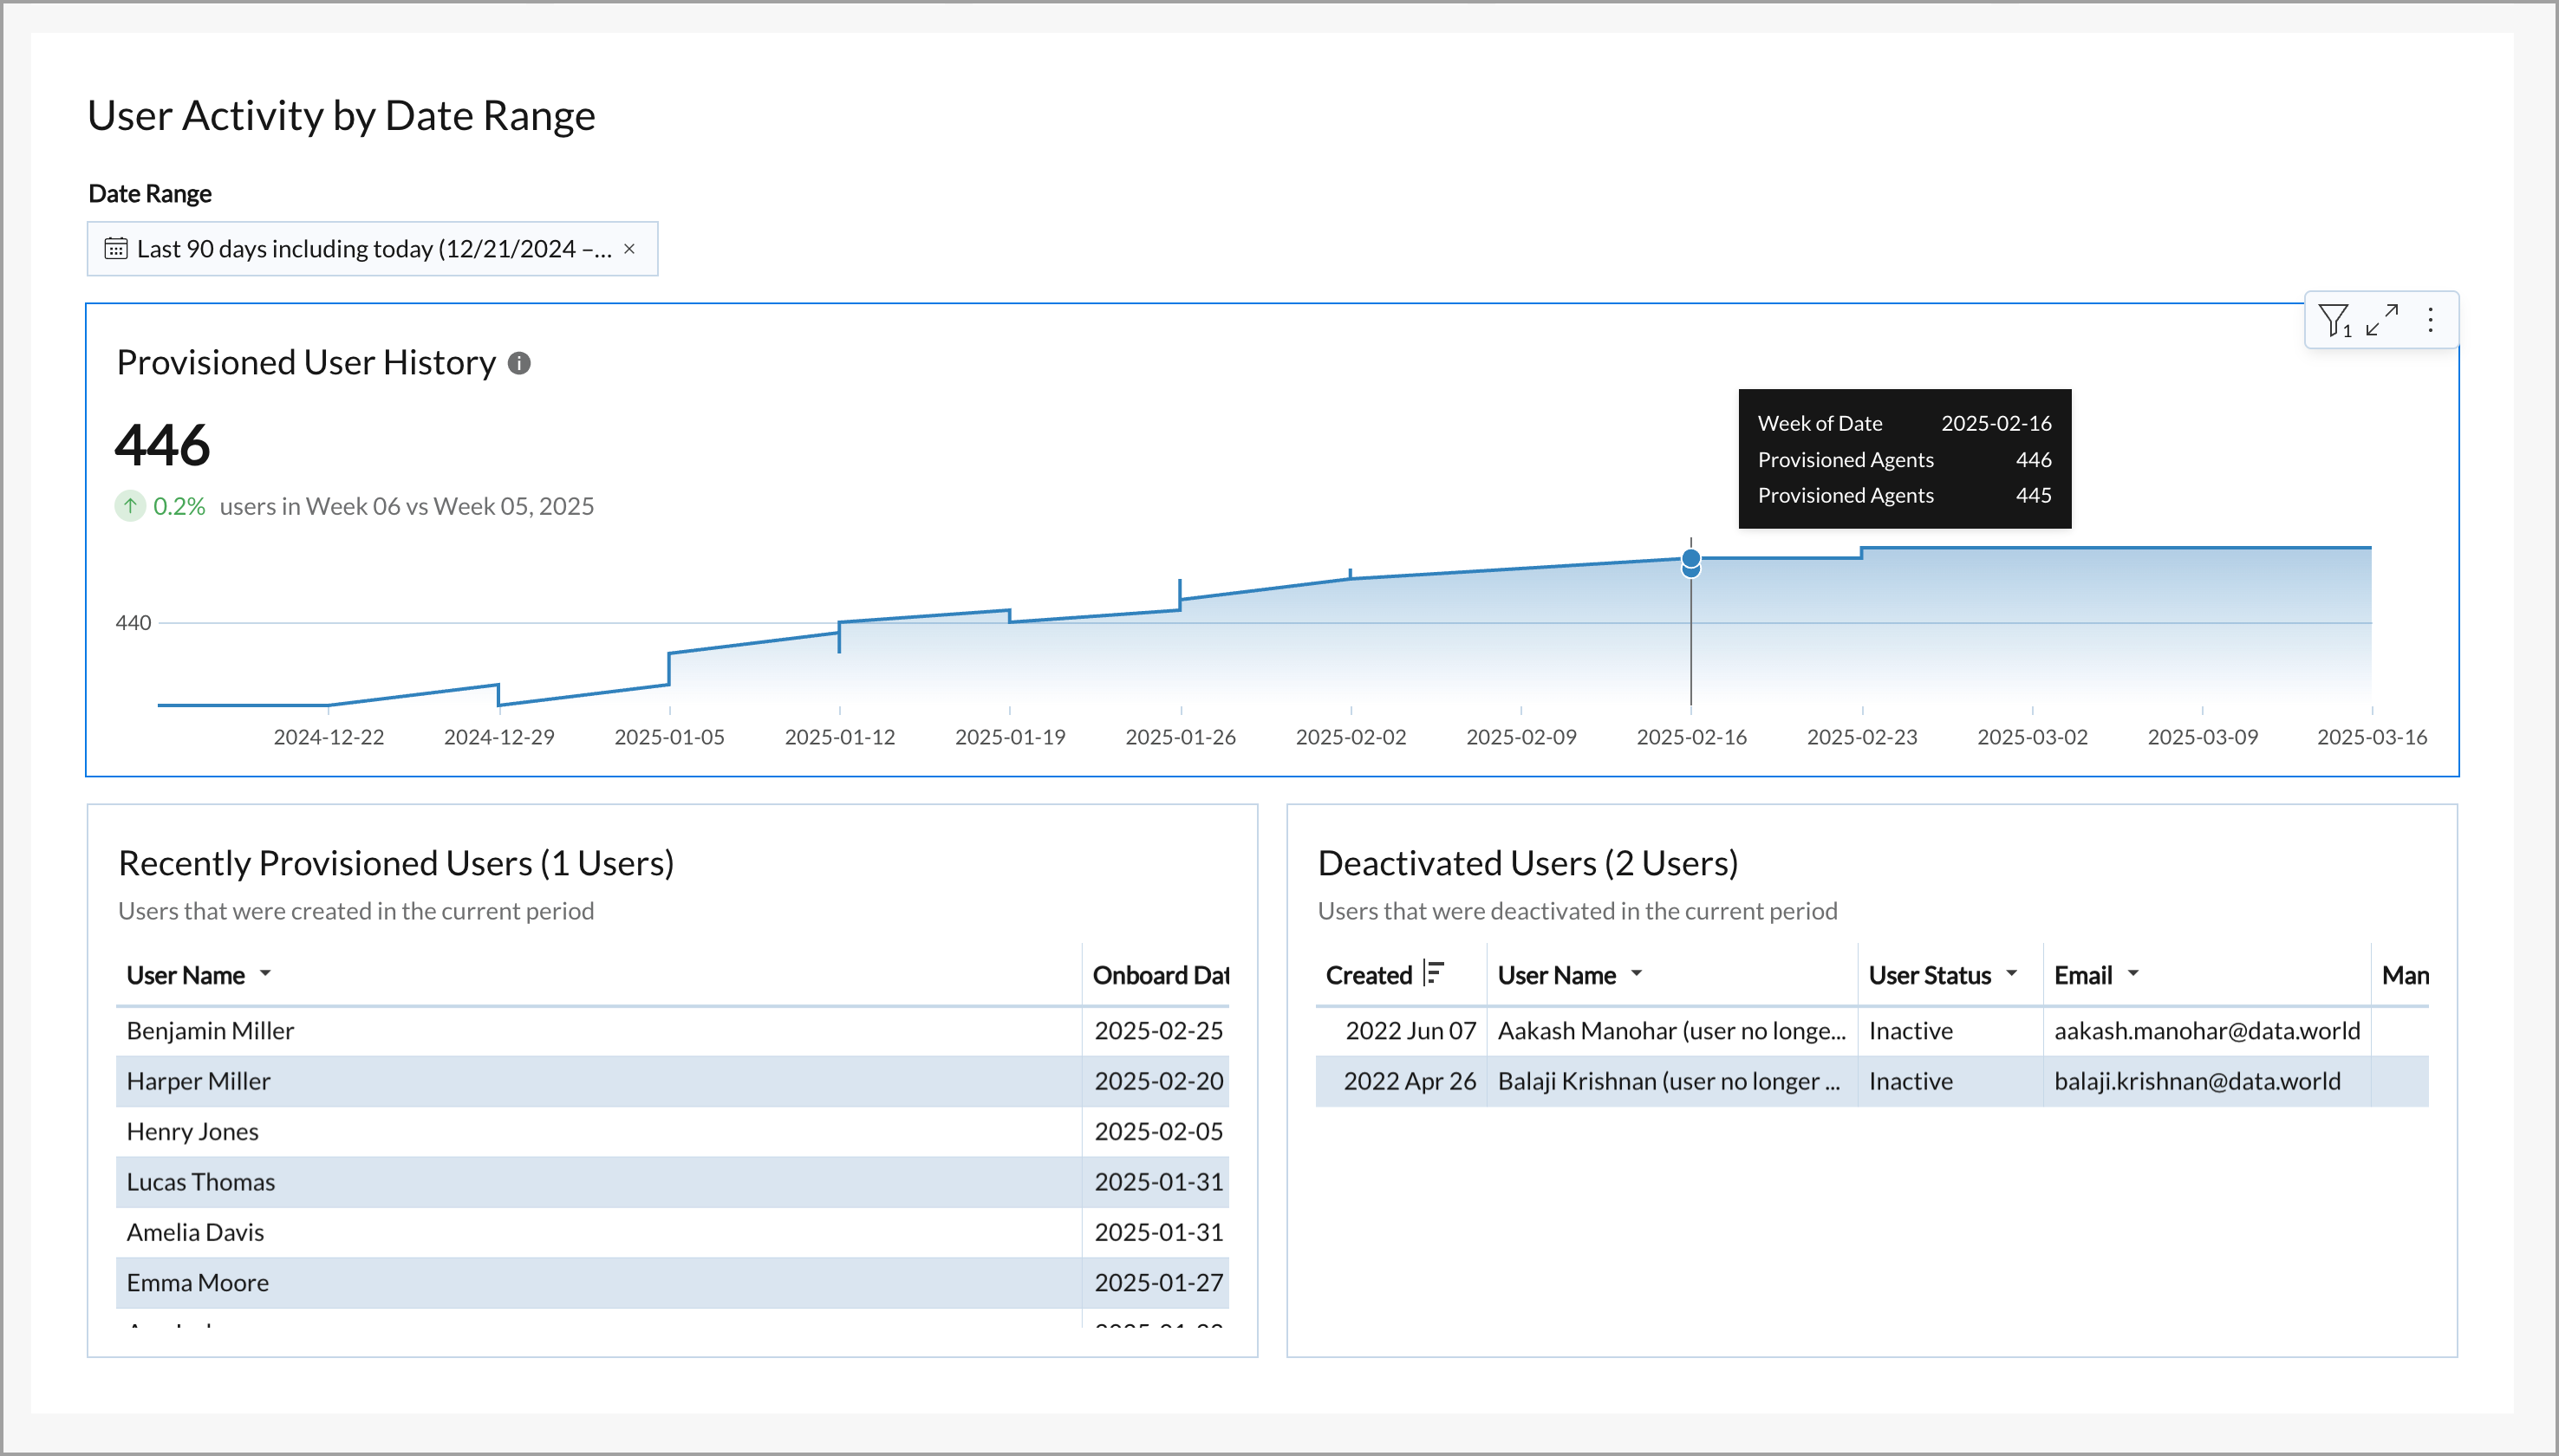
User activity by date range
Analyze user onboarding and deactivation patterns to improve retention strategies.
Dashboard | Details | Source for the dashboards |
|---|---|---|
Provisioned User History | Displays the growth of provisioned users over time, providing insight into adoption rates and user expansion. | Sourced from tables:
|
Recently Provisioned Users | Shows users who have been newly onboarded in the selected period, helping monitor onboarding effectiveness and growth trends. | Sourced from tables:
|
Deactivated Users | Highlights details on users who have been deactivated, including status and deactivation date, assisting in analysis and retention efforts. |
|
Exploring user data on the dashboard
To explore user data on the dashboard:
Go to the Dashboards page and click Users in the left pane.
The dashboard displays key user activity metrics.
To export the entire dashboard view, click the Export dashboard button. This captures a snapshot of all visible widgets and applied filters as a PDF — ideal for sharing, reporting, or archiving. For details, see Exporting dashboards
To export data or visualizations from individual dashboards, hover over any widget and click the Three-dot menu > Export. Available formats include CSV, JSON, Excel, PNG, and others.
Click the Three dot menu in any dashboard and select Refresh data to update the dashboard.
To expand a specific dashboard, hover over it and click Maximize Element. The expanded view shows a detailed view of the underlying data of the dashboard elements.
Filtering and analyzing user data
Each dashboard includes filter options to refine data and analyze user activity in detail.
To filter and analyze user data:
To apply a filter on all dashboards on the page, click the Global Filters button. In the Global Dashboard Filters window, select from the following:
Select Exclude Users by Selection to remove specific users from the dashboards.
Use Filter Users by Email Text to filter out users by specific criteria.
Ignore the Remove Deactivated Users option. This option does not apply to the Users Dashboards, which are already filtered by user status.
To use the filters for specific dashboard, hover over a dashboard and click Filters.
Use the following filtering options for the Provisioned users and Activated users dashboards.
Support user, service account and user status: Define the types of users and their status.
Use the following filtering options for the Daily, Weekly, Monthly Active Users dashboards:
Date: Define a timeframe for which data will be displayed. For example, selecting a specific date for the Weekly Active Users dashboard will display data for the seven days preceding the selected date.
Check Include Today to incorporate the latest data.
Use the following filter options for the Provisioned User History and Recently Provisioned Users dashboards:
Date Range: Define a custom timeframe to analyze user activity. Click the dropdown menu and select a predefined range (for example, Last 90 days).
Check Include Today to incorporate the latest data.
Sort and organize data:
Click the Column header name in the dashboard to access sorting options. Use available sorting options to arrange data effectively.
Click Column details to view summaries and insights about a specific column.
Copying and analyzing data:
Right-click any value inside a table and select Copy to clipboard to copy specific data values.
Use sorting and filtering tools to analyze user trend patterns within a specific time range.
Exporting dashboards
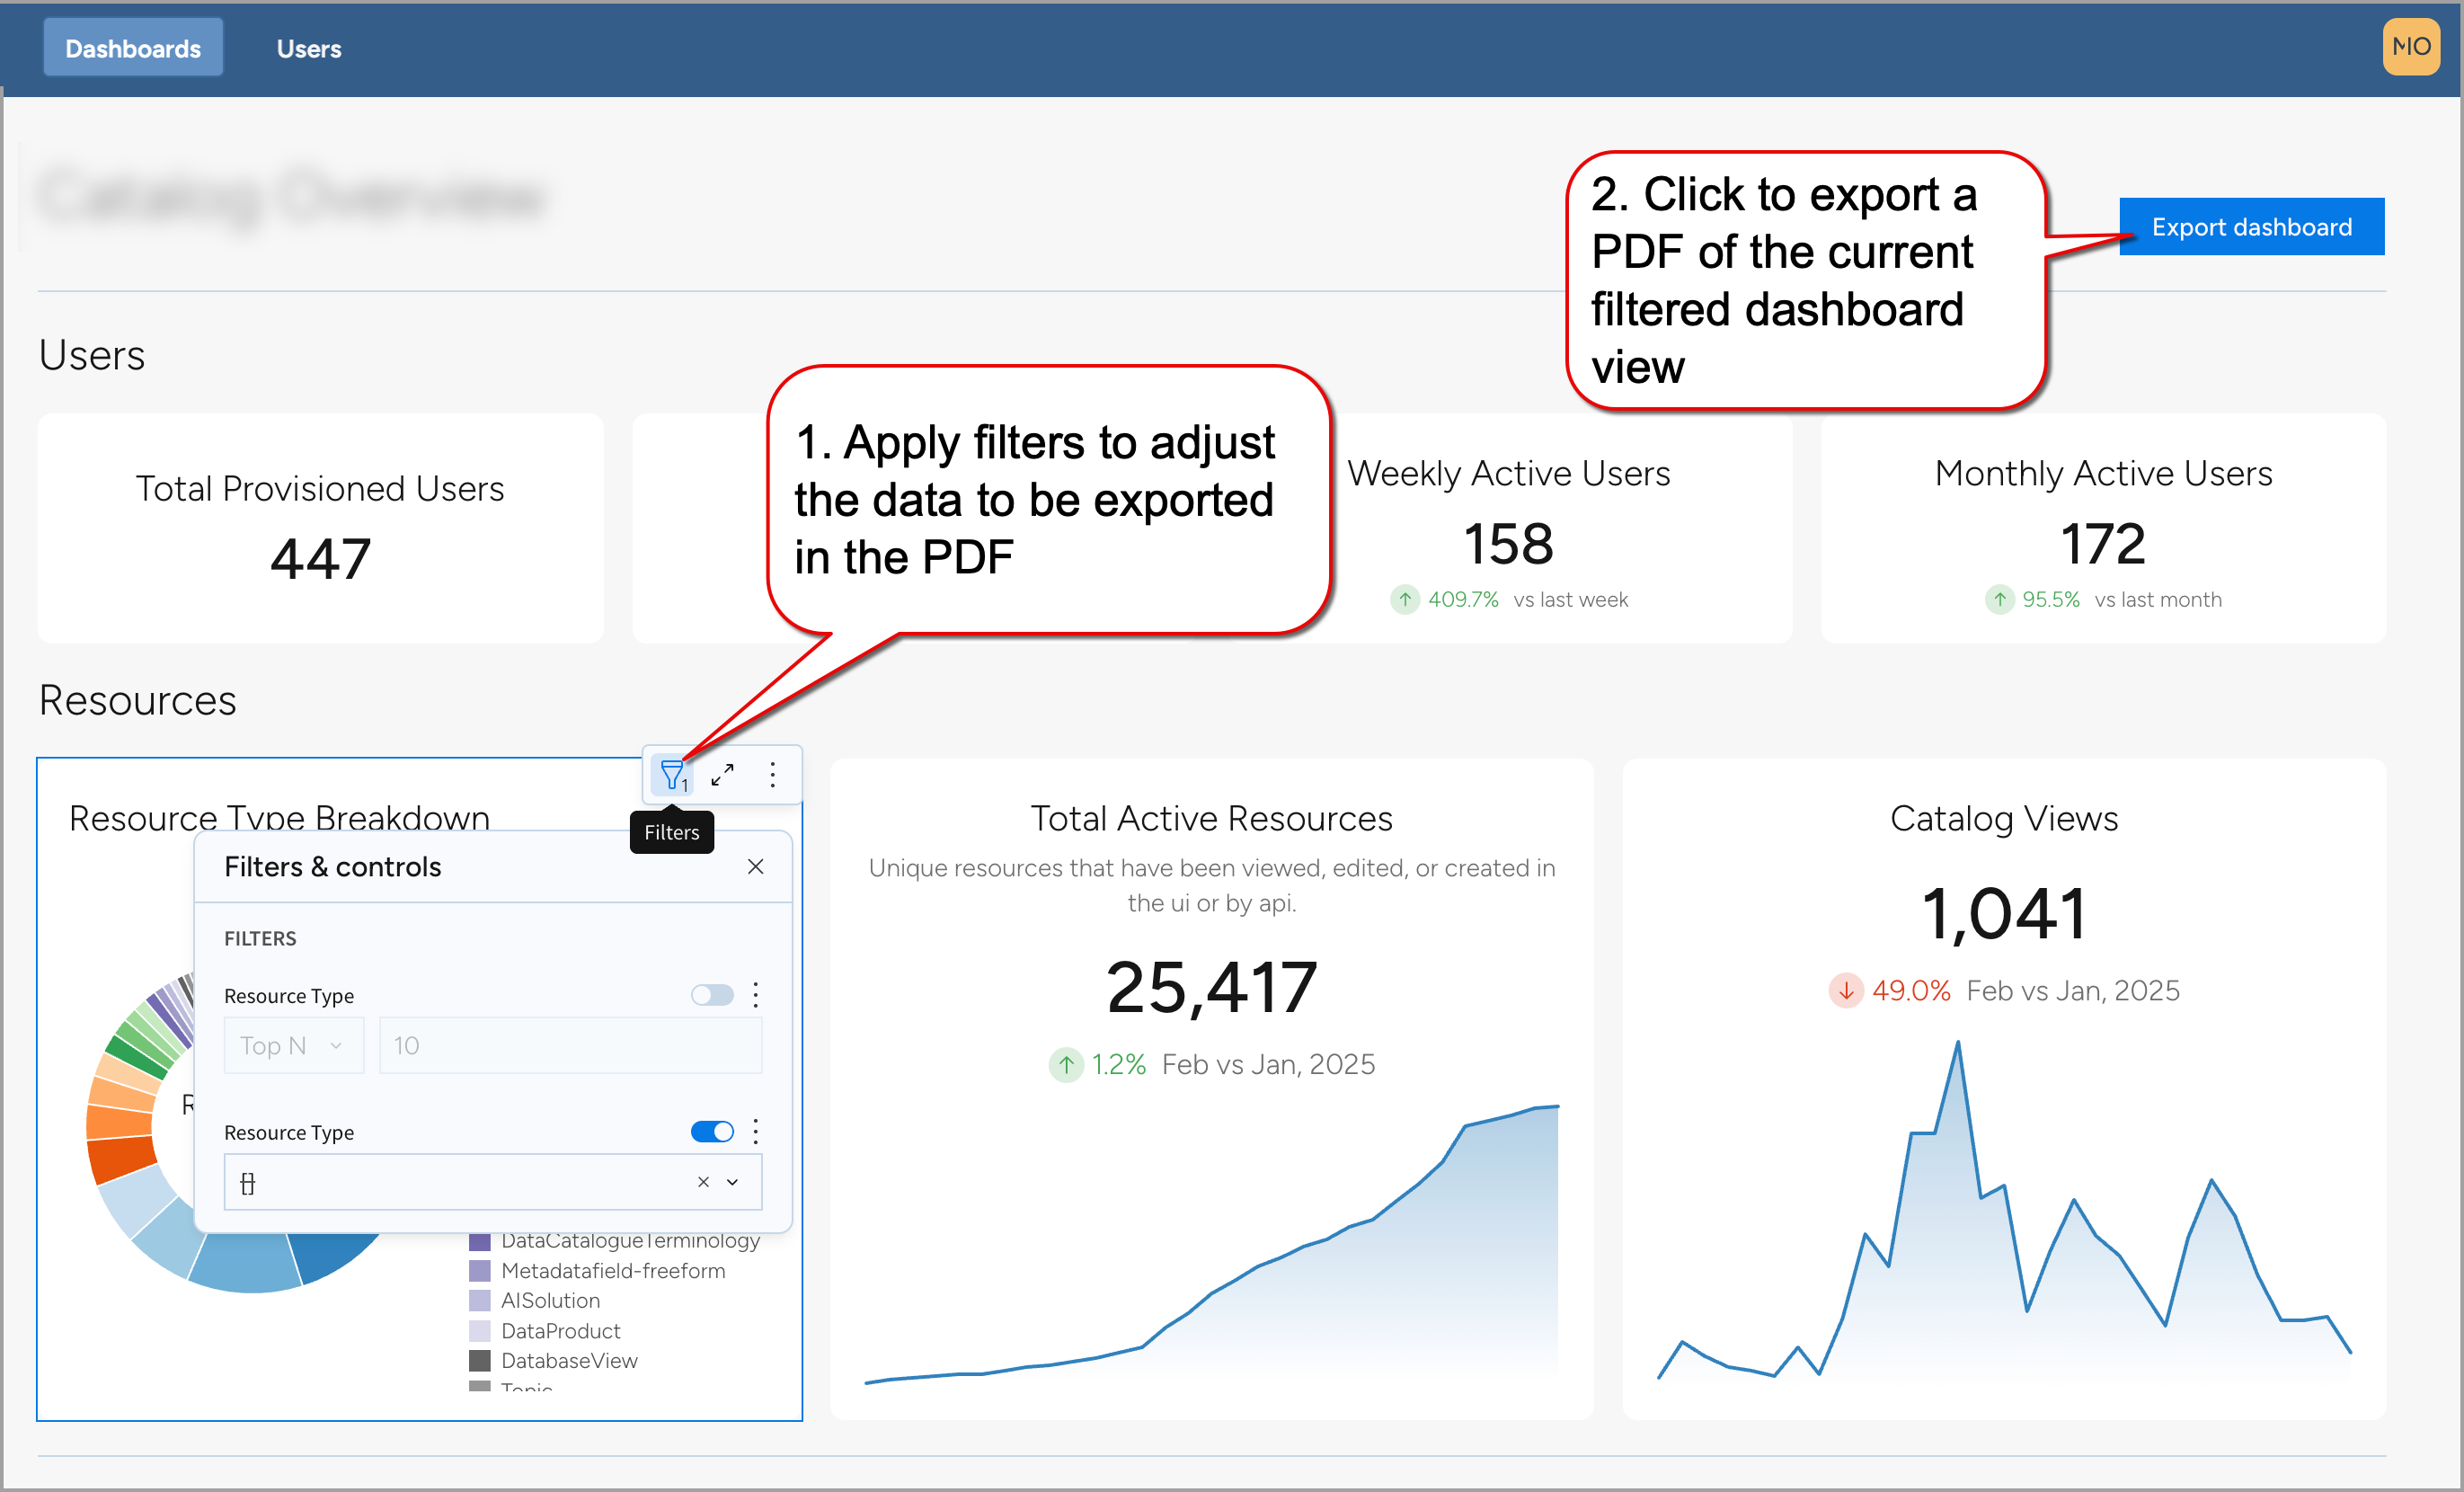
You can export the entire dashboard view as a PDF file. This is useful for sharing dashboard insights with others, archiving reports, or including snapshots in presentations.
The export captures all visible charts and widgets on the page, along with any filters that are currently applied.
To export the dashboard as a PDF:
Apply filters to customize the data shown in the export. For example, you can filter by date range, resource type, or specific metrics to tailor what appears in the final PDF.
Click the Export dashboard button at the top of the page.
The PDF file is saved automatically to your local device. The export reflects the current visible state of the dashboard, including all applied filters and settings.