Exploring relationships with Graph Explorer
About Graph explorer
Important
Graph Explorer is currently in beta. It is a read-only exploration tool and does not support modifying relationships or metadata.
Graph Explorer is an interactive, visual tool that helps you understand how data resources and business concepts are connected in your catalog. Built on top of your organization knowledge graph, it displays resources as nodes and relationships as arrows, giving you a clear, navigable map of related assets.
This tool supports semantic, conceptual, and governance connections across tables, dashboards, business terms, policies, and more — enabling faster discovery, better understanding, and more confident decision-making.
Benefits of Graph Explorer
Use Graph Explorer when you want to:
Quickly understand how a resource is connected to other items in your catalog.
Navigate relationships visually — including governance, glossary, and semantic links — without switching tabs or pages.
Explore the broader context around a resource by expanding and unpacking connections step by step.
Assess impact or coverage of policies, terms, or concepts across datasets and dashboards.
Uncover hidden relationships that might not be obvious in tabular views.
Graph Explorer helps data teams, analysts, and stewards move faster by reducing the time it takes to discover, investigate, and understand relationships across both business and technical resources.
How is Graph Explorer different from Explorer Lineage?
Both Graph Explorer and Lineage (Eureka Explorer) help you explore relationships in your data catalog — but they serve different purposes.
Lineage (Eureka Explorer) focuses on technical data flow — how data moves and transforms across systems. It shows lineage that is automatically collected from supported data sources, helping you understand where data came from, how it was transformed, and what depends on it downstream. This is super useful for debugging, pipeline failures, and building trusts.
Use Lineage Explorer when you are tracking how data moves and changes across systems.
Graph Explorer focuses on business and conceptual relationships between resources in your catalog — visualizing connections that have been defined manually or captured by collectors. It helps you understand the semantic context of your catalog.
Use Graph Explorer when you are exploring meaning, structure, or business relationships.
Enabling access to graph explorer feature
To enable access to the graph explorer feature:
On the Settings page, go the Advanced tab to enable the Experimental feature option.
Select the Enable experimental features option in your account settings.

Viewing relationships in Graph Explorer
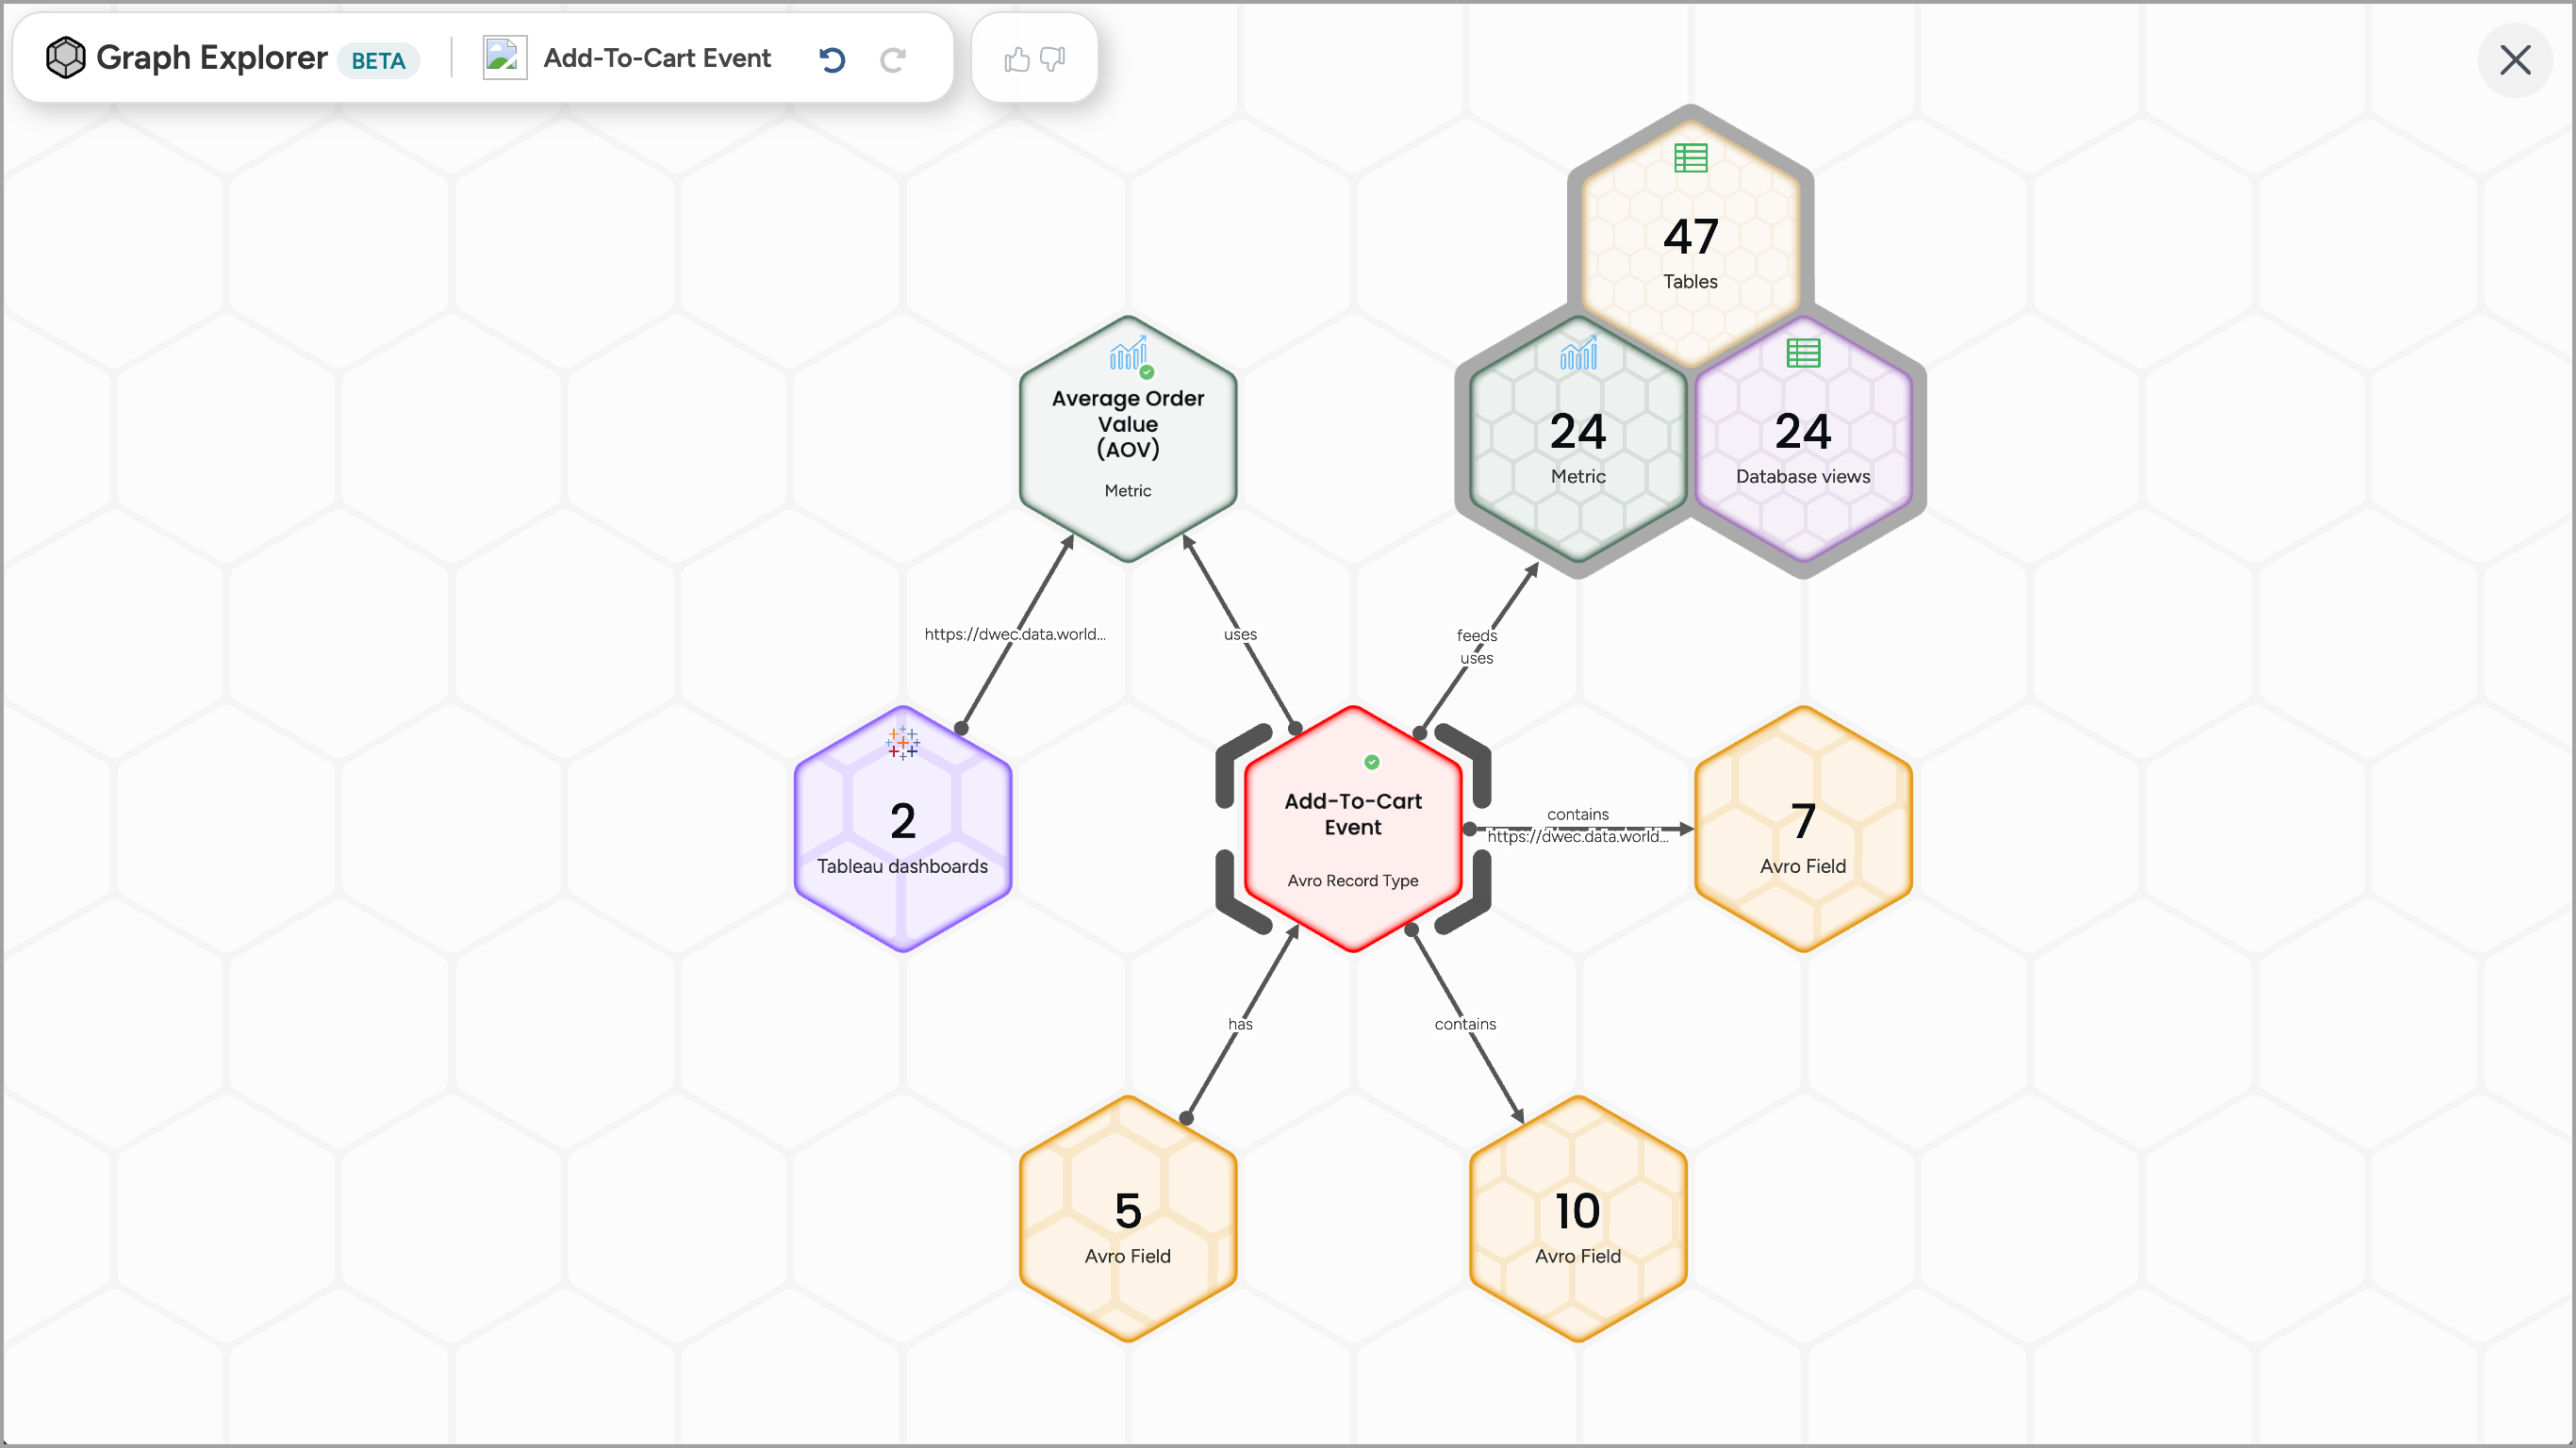
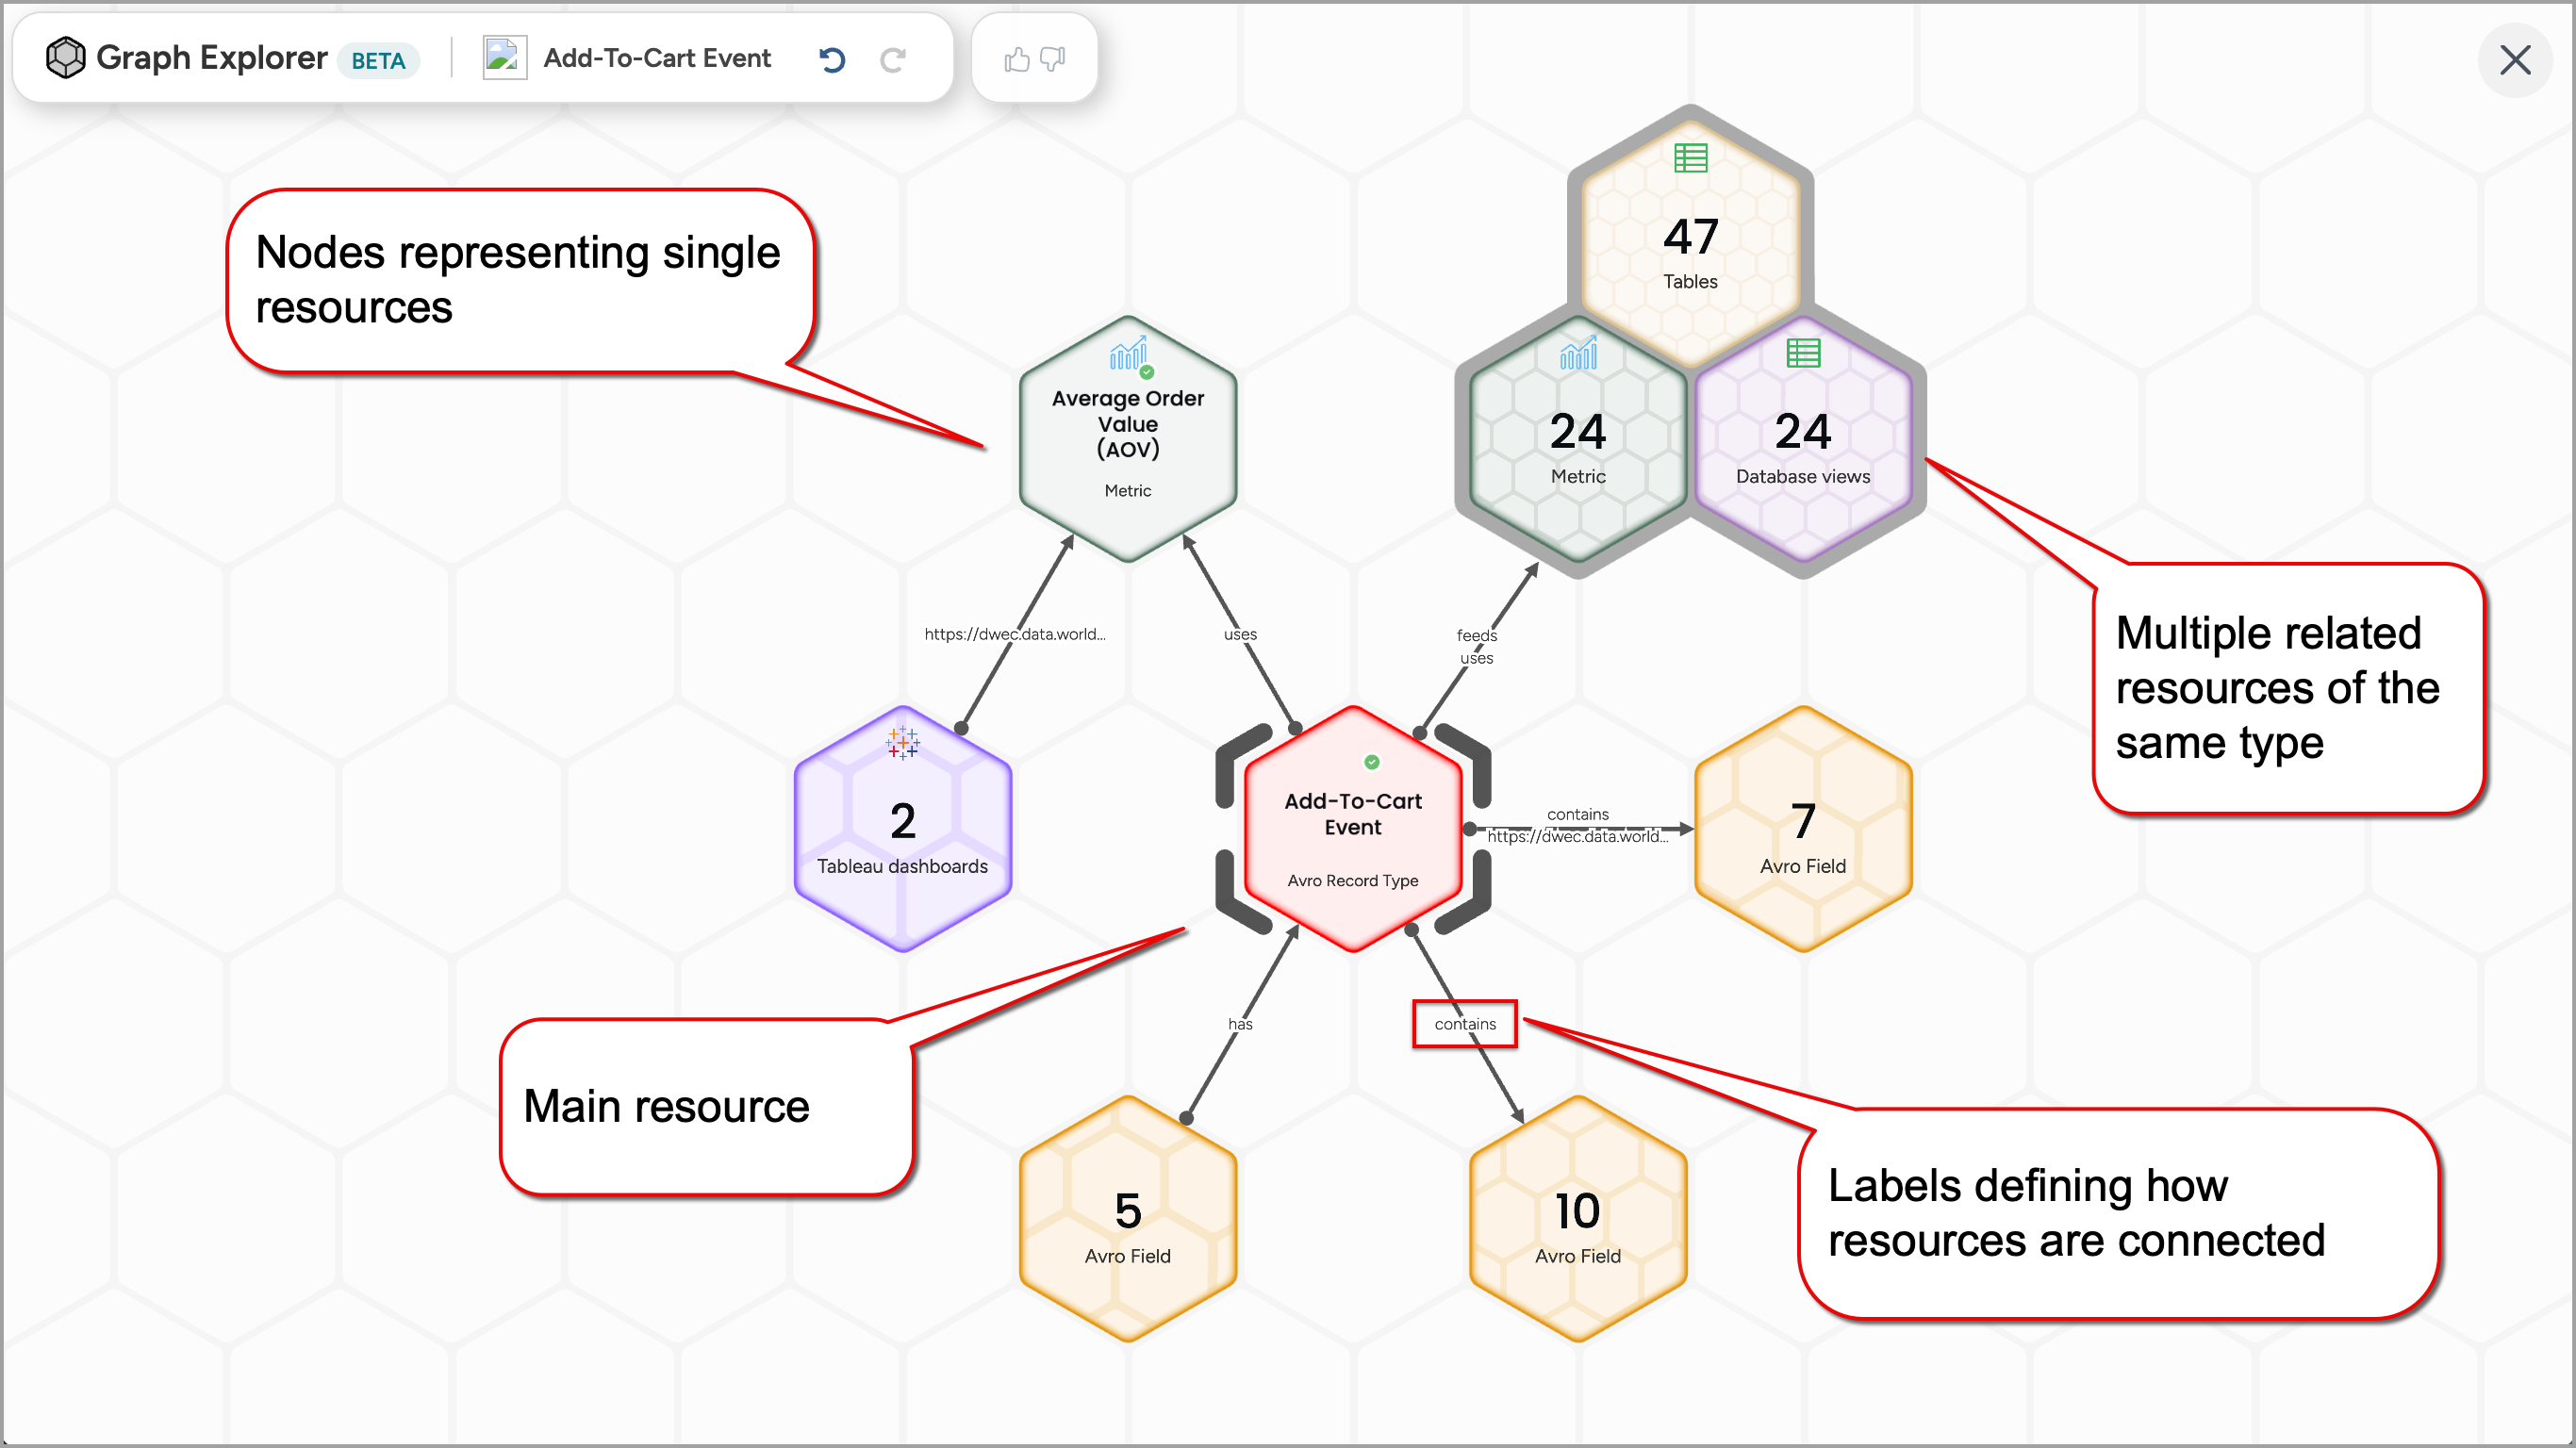
When you open Graph Explorer from a resource, that resource appears as the central node in an interactive graph. Related resources appear around it as connected nodes. Each node represents a catalog resource or a group of resources (such as a table, dashboard, or glossary term), and arrows between them indicate relationship types and direction — such as:
contains
relates to
embeds
has access to
Connections may represent individual resources, or grouped nodes (such as 575 Tables, 2 Data Products) when multiple resources of the same type are related. This helps simplify large graphs while still providing full access to explore in detail.
To explore the relationships:
Locate a resource that has defined relationships with other resources — for example, a Database, Table, Dashboard, Business Term, or others.
On the resource page, in the top toolbar, click the Explore button. The Graph Explorer opens in full screen mode.
The central node in the graph represents the resource from which you launched the Graph Explorer. All connected nodes represent different types of related resources, with arrows indicating the type of relationship. This is the same information shown in the Related tab of the resource, but presented visually—making it easier to understand and explore the relationships at a glance.
Hover over the center node to preview its relationships to the connected nodes.
Hover over any related node to see the resources it contains and its relation to the central node. For example, hovering over a 5 Business Metrics node will display the list of included metrics.
Move nodes freely across the canvas to customize your layout. To recenter the view, simply press the Spacebar on the keyboard.
Exploring related resources from the Graph Explorer
Graph Explorer allows you to expand relationships step by step as you explore. You can unpack grouped nodes to reveal individual resources, and show related items to explore their connections.
This helps you navigate complex relationships without being overwhelmed — only revealing what is relevant as you go deeper into the graph.
Unpacking grouped nodes
Grouped nodes (such as 5 Business Terms or 2 Data Products) represent multiple resources of the same type. You can unpack them to view and interact with each resource individually.
To unpack grouped resources:
Click the grouped node.
Click the Unpack resources button.
A list of individual resources appears. Use the Filter field to quickly locate a resource by name.
Click the resource you want to unpack. It now appears as an individual node connected to the graph.
For example: Click the Tables node, then click the Unpack resources button, filter for cust_customer, and click it. The cust_customer table node appears and is connected to the graph.
You can repeat this action to continue unpacking other grouped resources.
Reverse or repeat your latest actions in Graph Explorer using the Undo and Redo buttons in the top toolbar. These actions help you stay in control as you explore relationships.
Viewing relationships of related resources
Any individual node may have its own set of relationships. Click Show related to expand and view those additional connections.
To show related resources:
Click the individual node you want to explore further.
Click the Show related button.
A list of related resource types appears. Select which ones you want to display.
For example: Click the cust_customer table node, click the Show related button, and choose to expand 2 Data Products. A grouped node for 2 Data Products appears, connected to cust_customer.
You can now unpack those data products to see each one as its own node. For example: Customer Retention and Fraud Monitoring.
Continue unpacking and showing relationships as needed. Graph Explorer supports progressive discovery — letting you choose when and how to expand each part of the graph.
If a resource has no more relationships to display, the Show related button is disabled.
To hide a relationship, simply click the Hide related button.
Reverse or repeat your latest actions in Graph Explorer using the Undo (or shortcuts CMD+z [for mac] or Ctrl+z [for Windows]) and Redo (CMD+y [for mac] or Ctrl+y [for windows]) buttons in the top toolbar. These actions help you stay in control as you explore relationships.
Viewing resource details
You can view metadata details for any individual resource directly within Graph Explorer, without navigating away from the graph view.
To open a resource metadata:
Click a resource node, not a grouped node, on the canvas.
Click the View details button.
The selected resource opens in a side panel with full metadata, including title, type, description, owner, and relevant tags.
The side panel allows you to stay in context while inspecting resource-level metadata, making it easier to assess relevance before expanding relationships or unpacking additional resources.
Review the metadata as needed. When finished, click the Close button to return to the full graph view.
Providing feedback
We invite you to provide feedback on the new Graph Explorer feature while you use it. Your insights are crucial for improving your experience.
To share your feedback:
Click the
 Thumbs-up or Thumbs-down buttons for positive or negative rating.
Click the Tell us more link to provide additional feedback in the text field to help us understand your experience in more detail. Click the Send Feedback button.