Viewing resources dashboards
Resources Dashboards provide insights into resource activity, usage trends, and catalog management on data.world.
Use these dashboards to:
Monitor resource activity across different timeframes to track resource engagement and usage.
Analyze top resource types to understand which resources are most utilized.
Track catalog modifications to see how resources are being created, edited, and managed
Key resources dashboards
Explore the following dashboards with key metrics available on the Resources dashboard page.
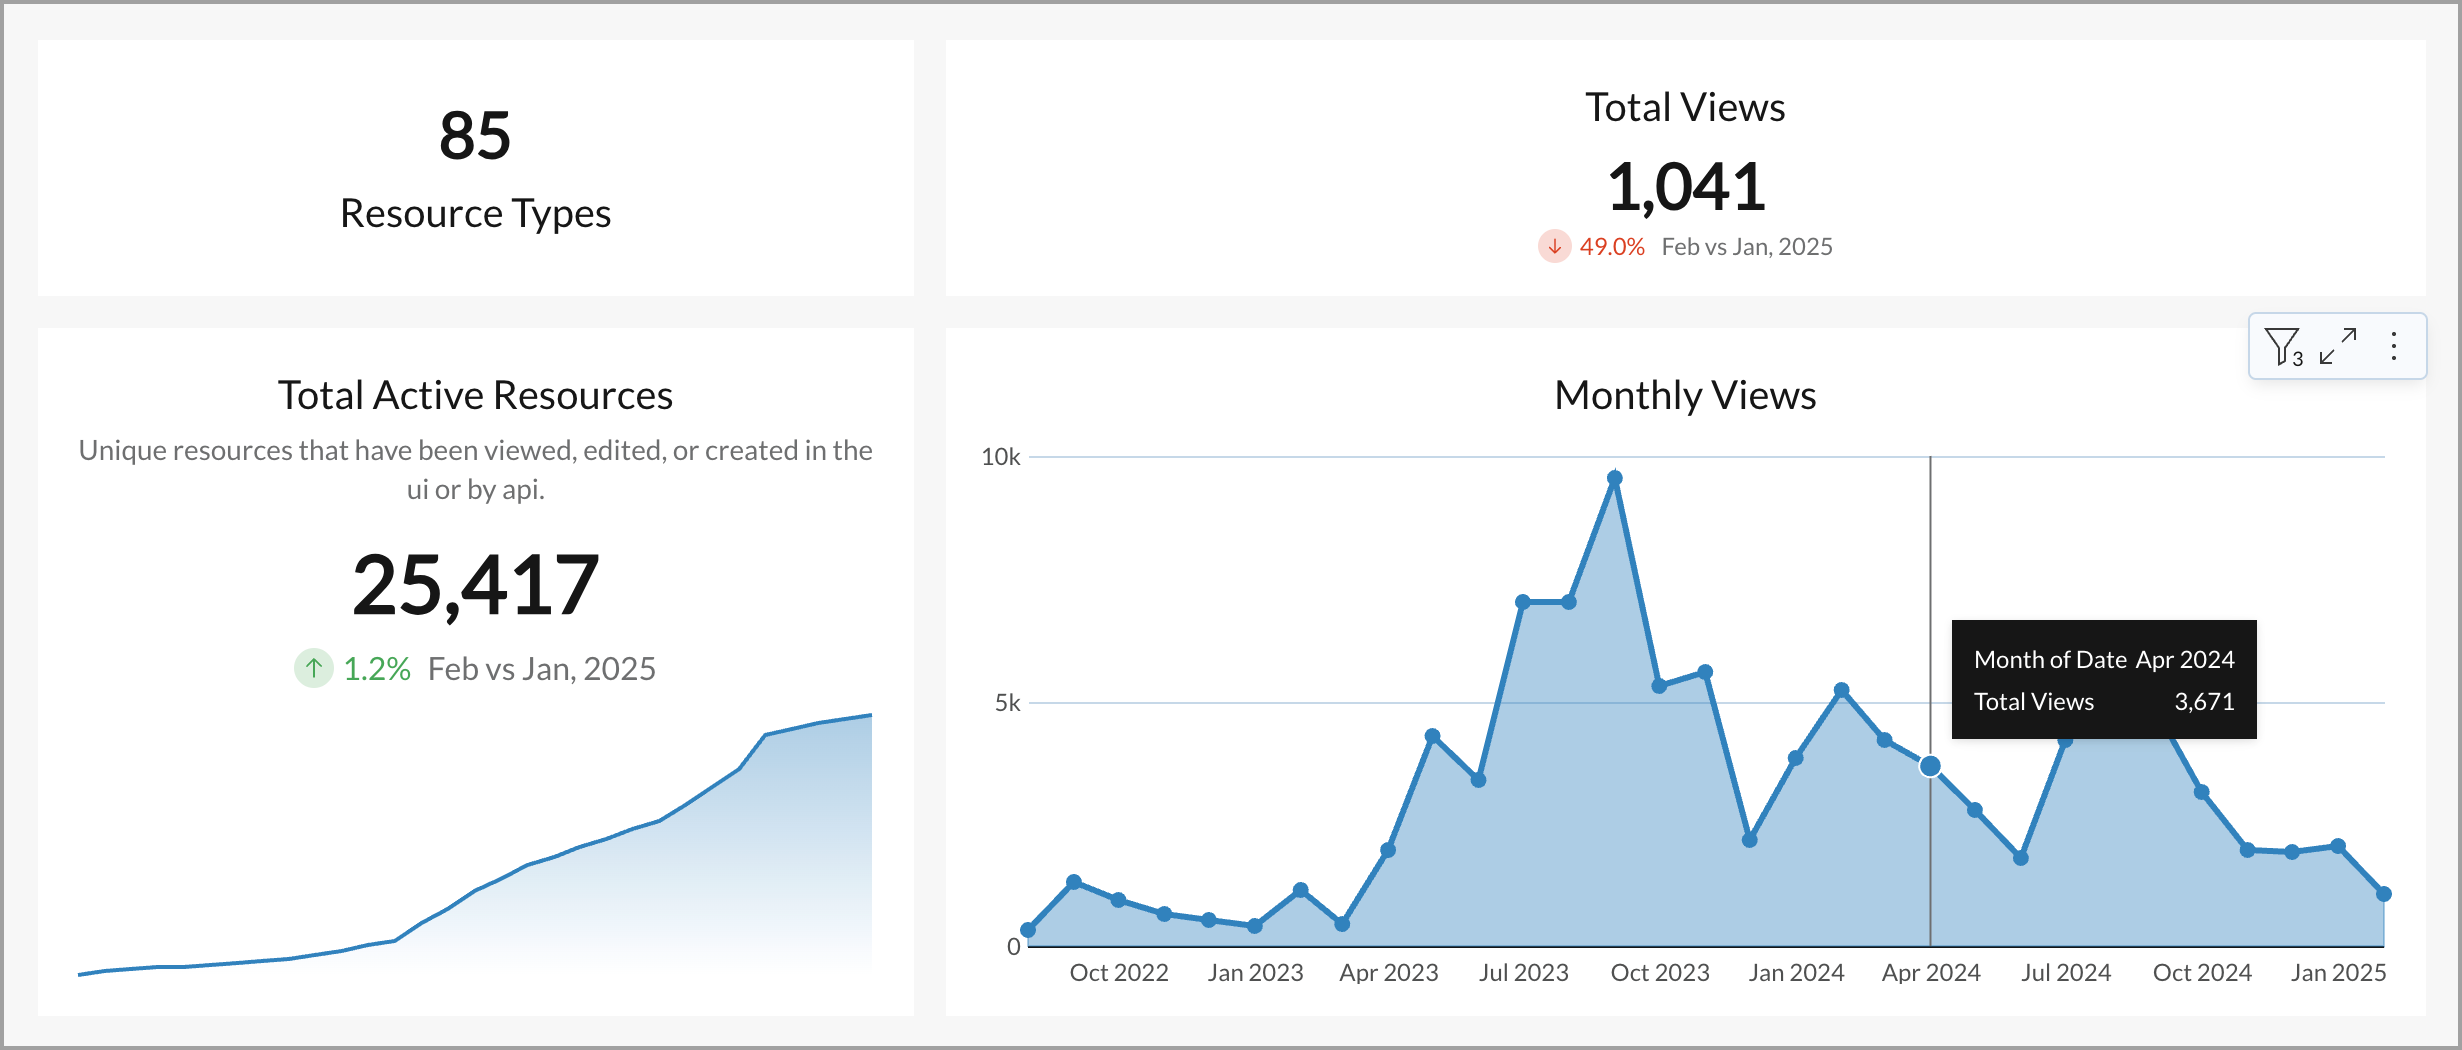
Resource overview
This section helps users understand the overall structure and activity of resources in the catalog.
Dashboard | Details | Source for the dashboards |
|---|---|---|
Resource Types | Displays the total number of different resource types in the system, helping track catalog diversity. | Sourced from tables:
|
Total Views | Shows the overall number of resource views, allowing teams to analyze resource engagement. | |
Total Active Resources | Highlights the number of unique resources that have been viewed, edited, or created, providing insights into catalog activity. | |
Monthly Views | Displays trends in resource views over time, helping identify patterns in resource consumption. |
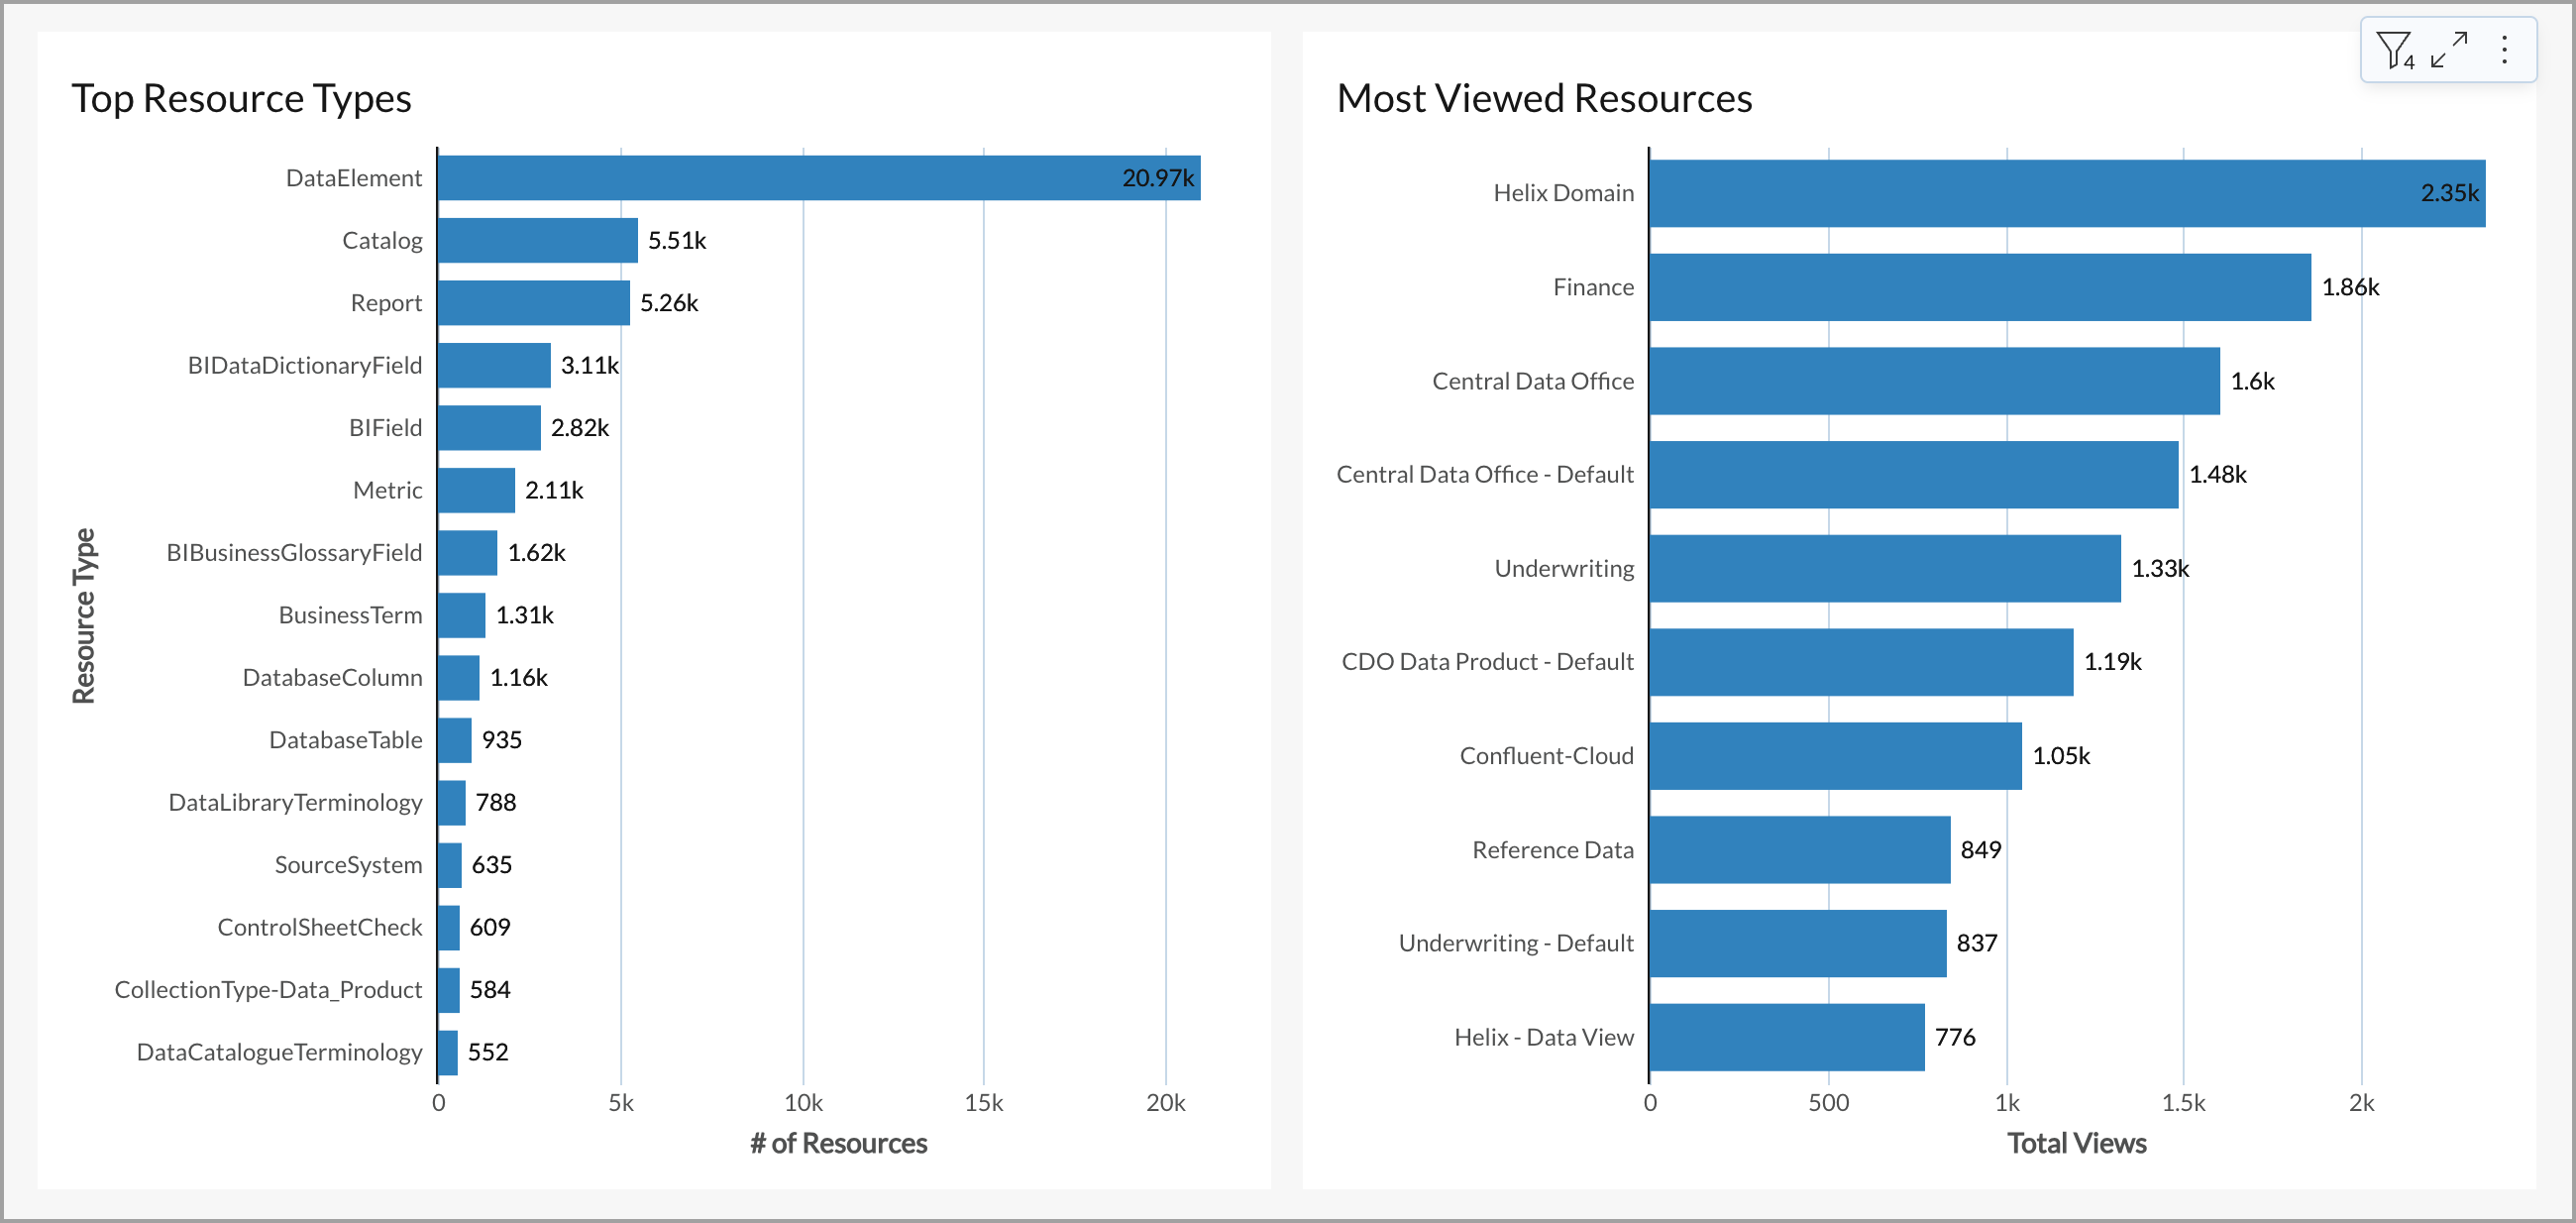
Top resources
Analyze which resources are most frequently accessed and their overall impact
Dashboard | Details | Source for the dashboards |
|---|---|---|
Top Resource Types | Lists the most commonly used resource types, helping identify key content categories. | Sourced from tables:
|
Most Viewed Resources | Highlights the most accessed resources, providing insights into user interests and key assets. |
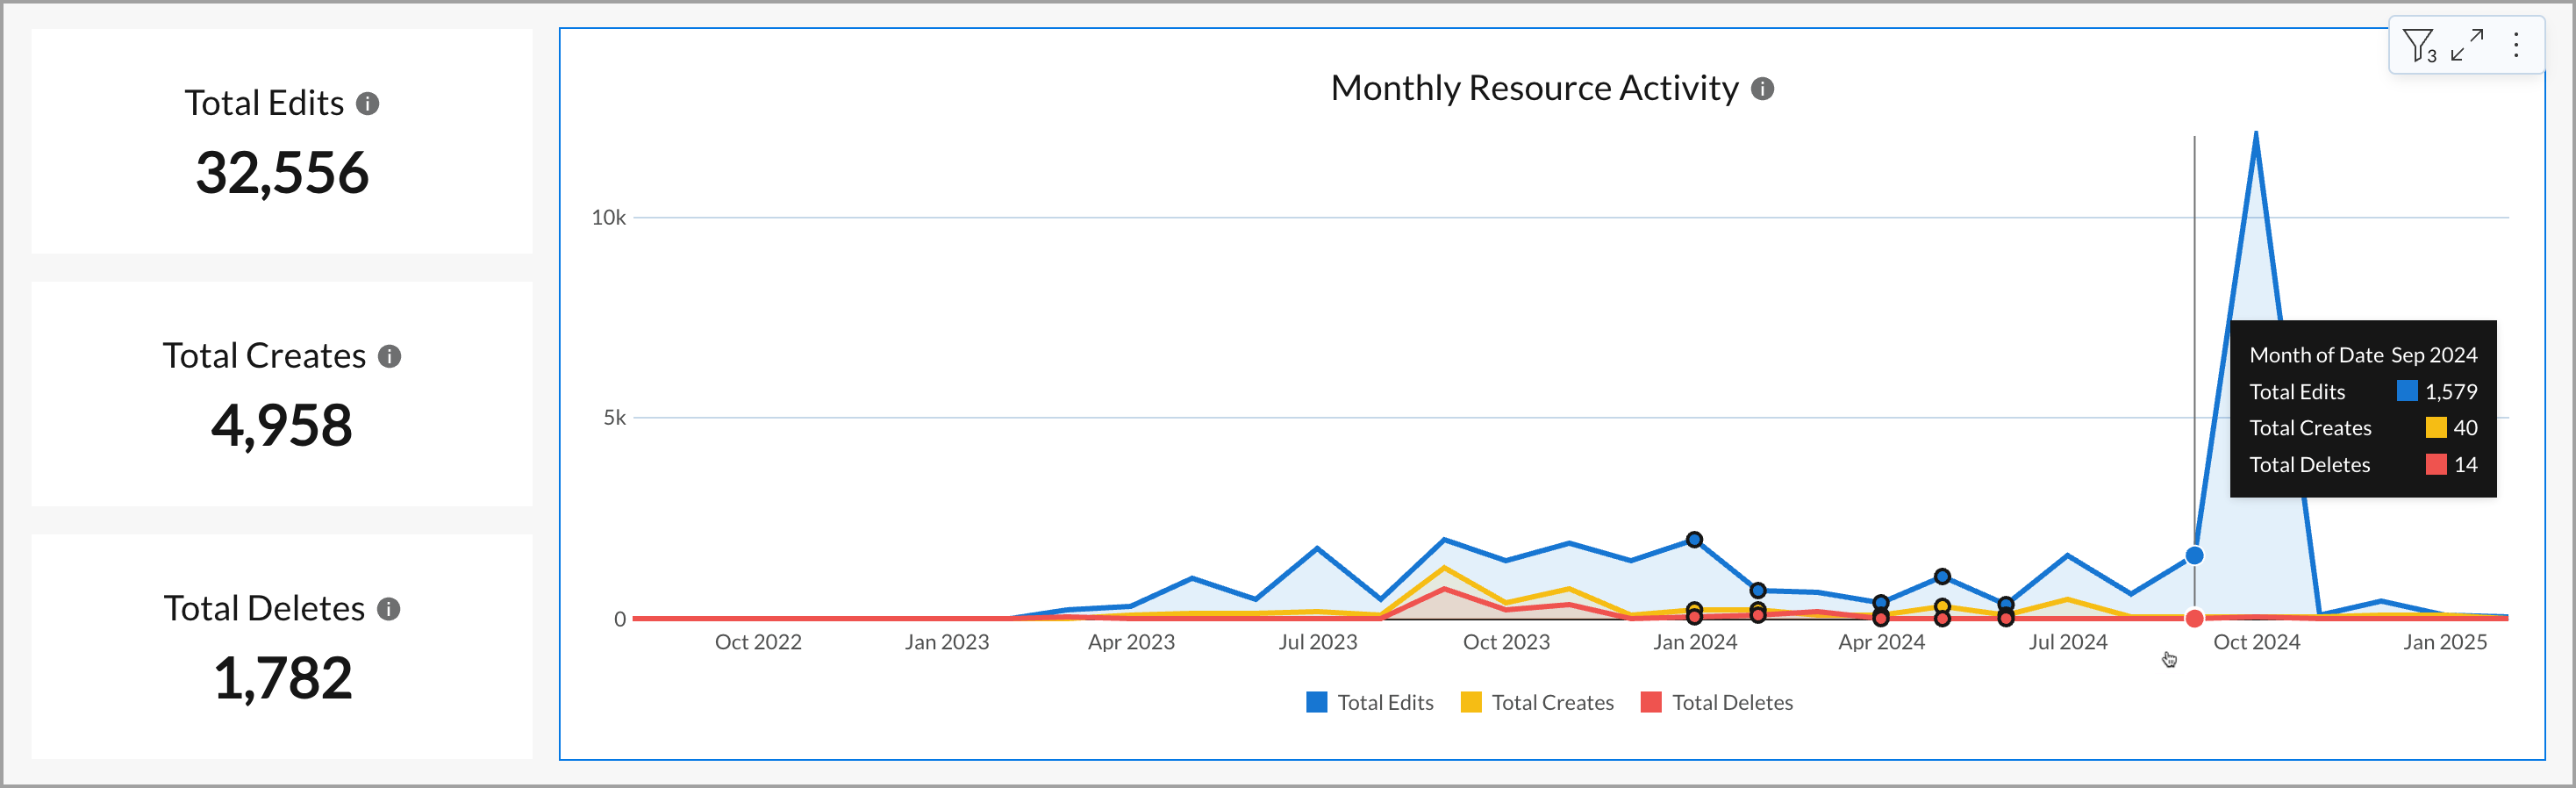
Catalog resource activity
Monitor changes within the catalog to track how content is being managed and updated over time.
Dashboard | Details | Source for the dashboards |
|---|---|---|
Total Edits, Creates, Deletes | Displays the number of edits, creations, and deletions within the catalog, allowing you to monitor how users manage resources. | Sourced from tables:
|
Monthly Resource Activity | Highlights trends in catalog modifications over time through an interactive visual graph, making it easy to compare activity spikes and track content updates in a visually engaging way. |
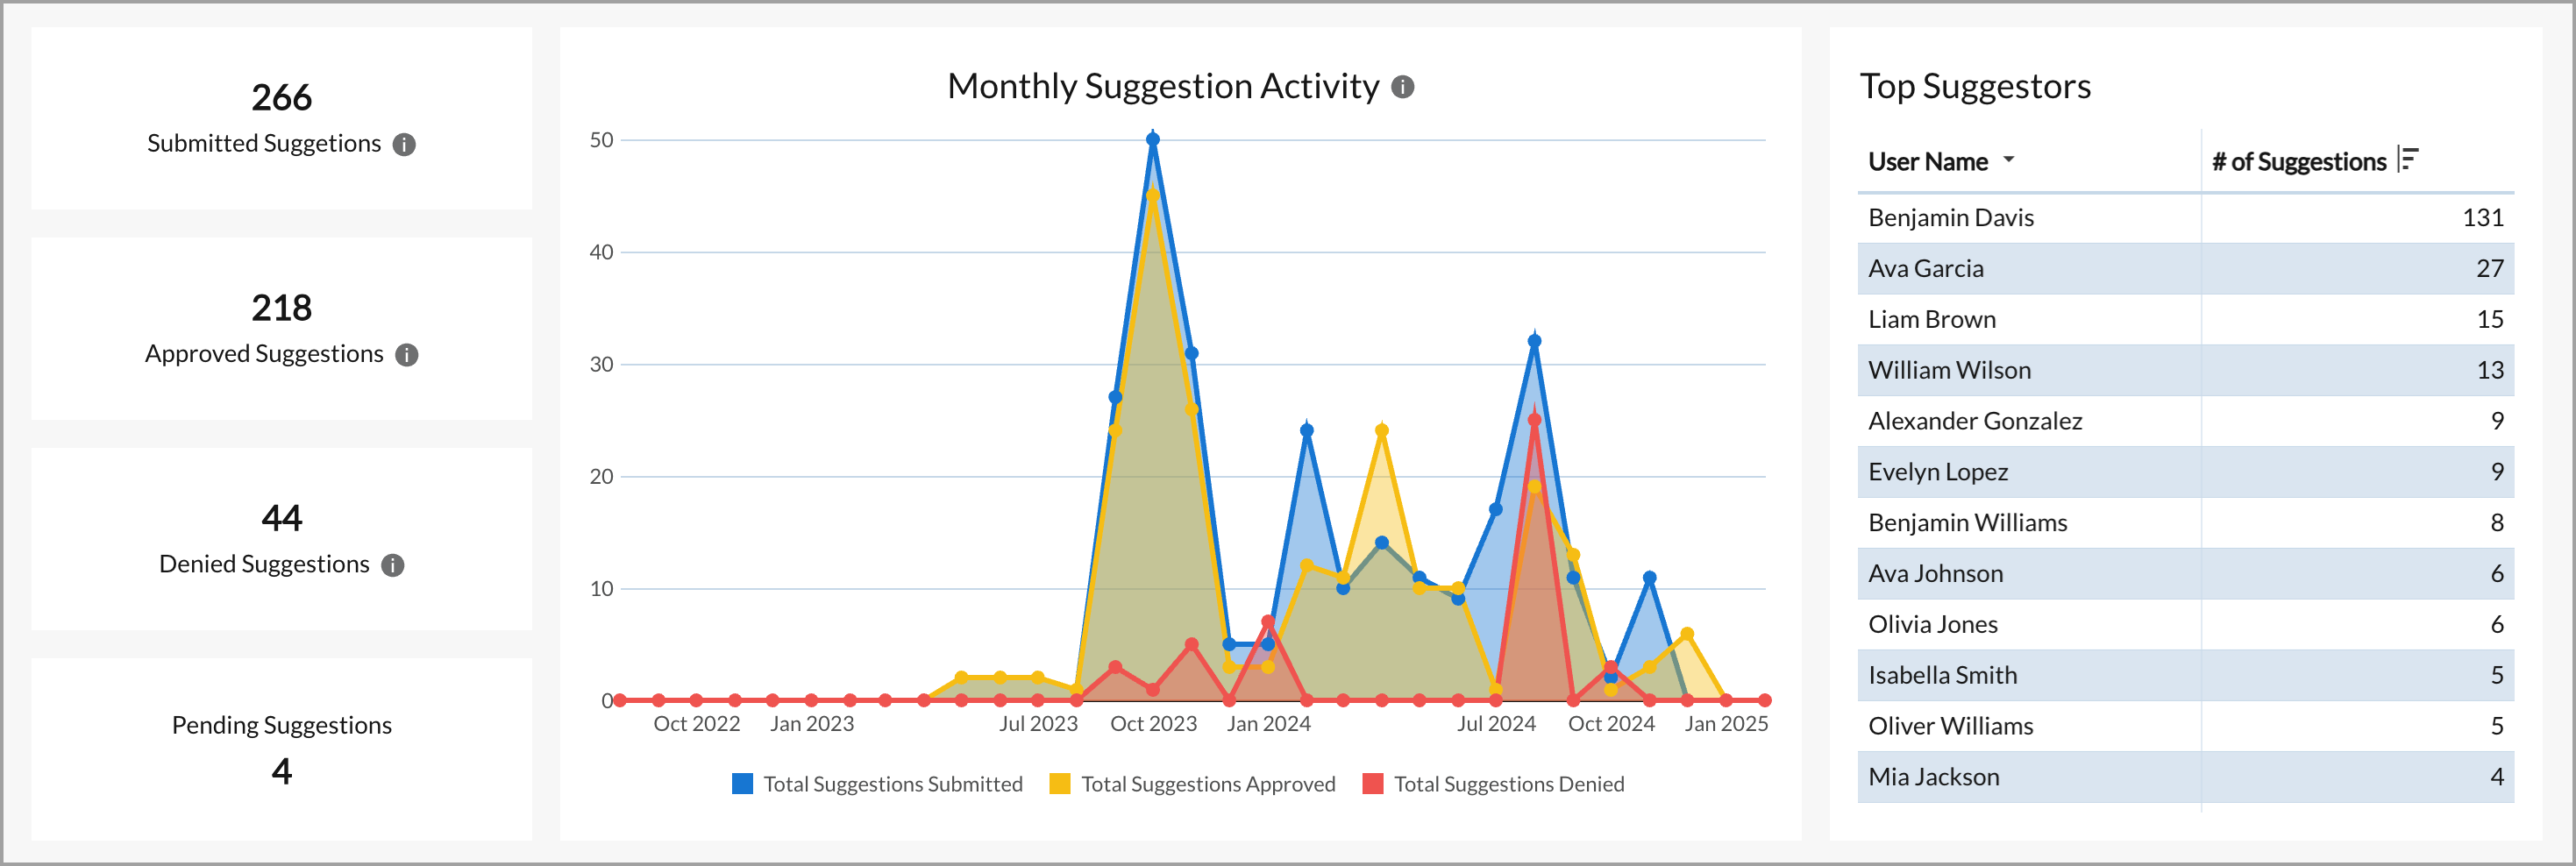
Catalog suggestion activity
Track and analyze user-driven resource suggestions for catalog improvements. If your catalog has no user suggestions, this data remains empty.
Dashboard | Details | Source for the dashboards |
|---|---|---|
Submitted, Approved, Denied, and Pending Suggestions | Tracks the life cycle of user-submitted suggestions, providing visibility into user contributions and how they impact the catalog. | Sourced from tables:
|
Monthly Suggestions Activity | Displays trends in suggestion submissions, approvals, and denials over time through a visual graph, making it easier to analyze engagement patterns. | Sourced from tables:
|
Top Suggestors | Lists users who have submitted the most suggestions, displaying their user name and amount of suggestions, helping recognize active contributors. | Sourced from tables:
|
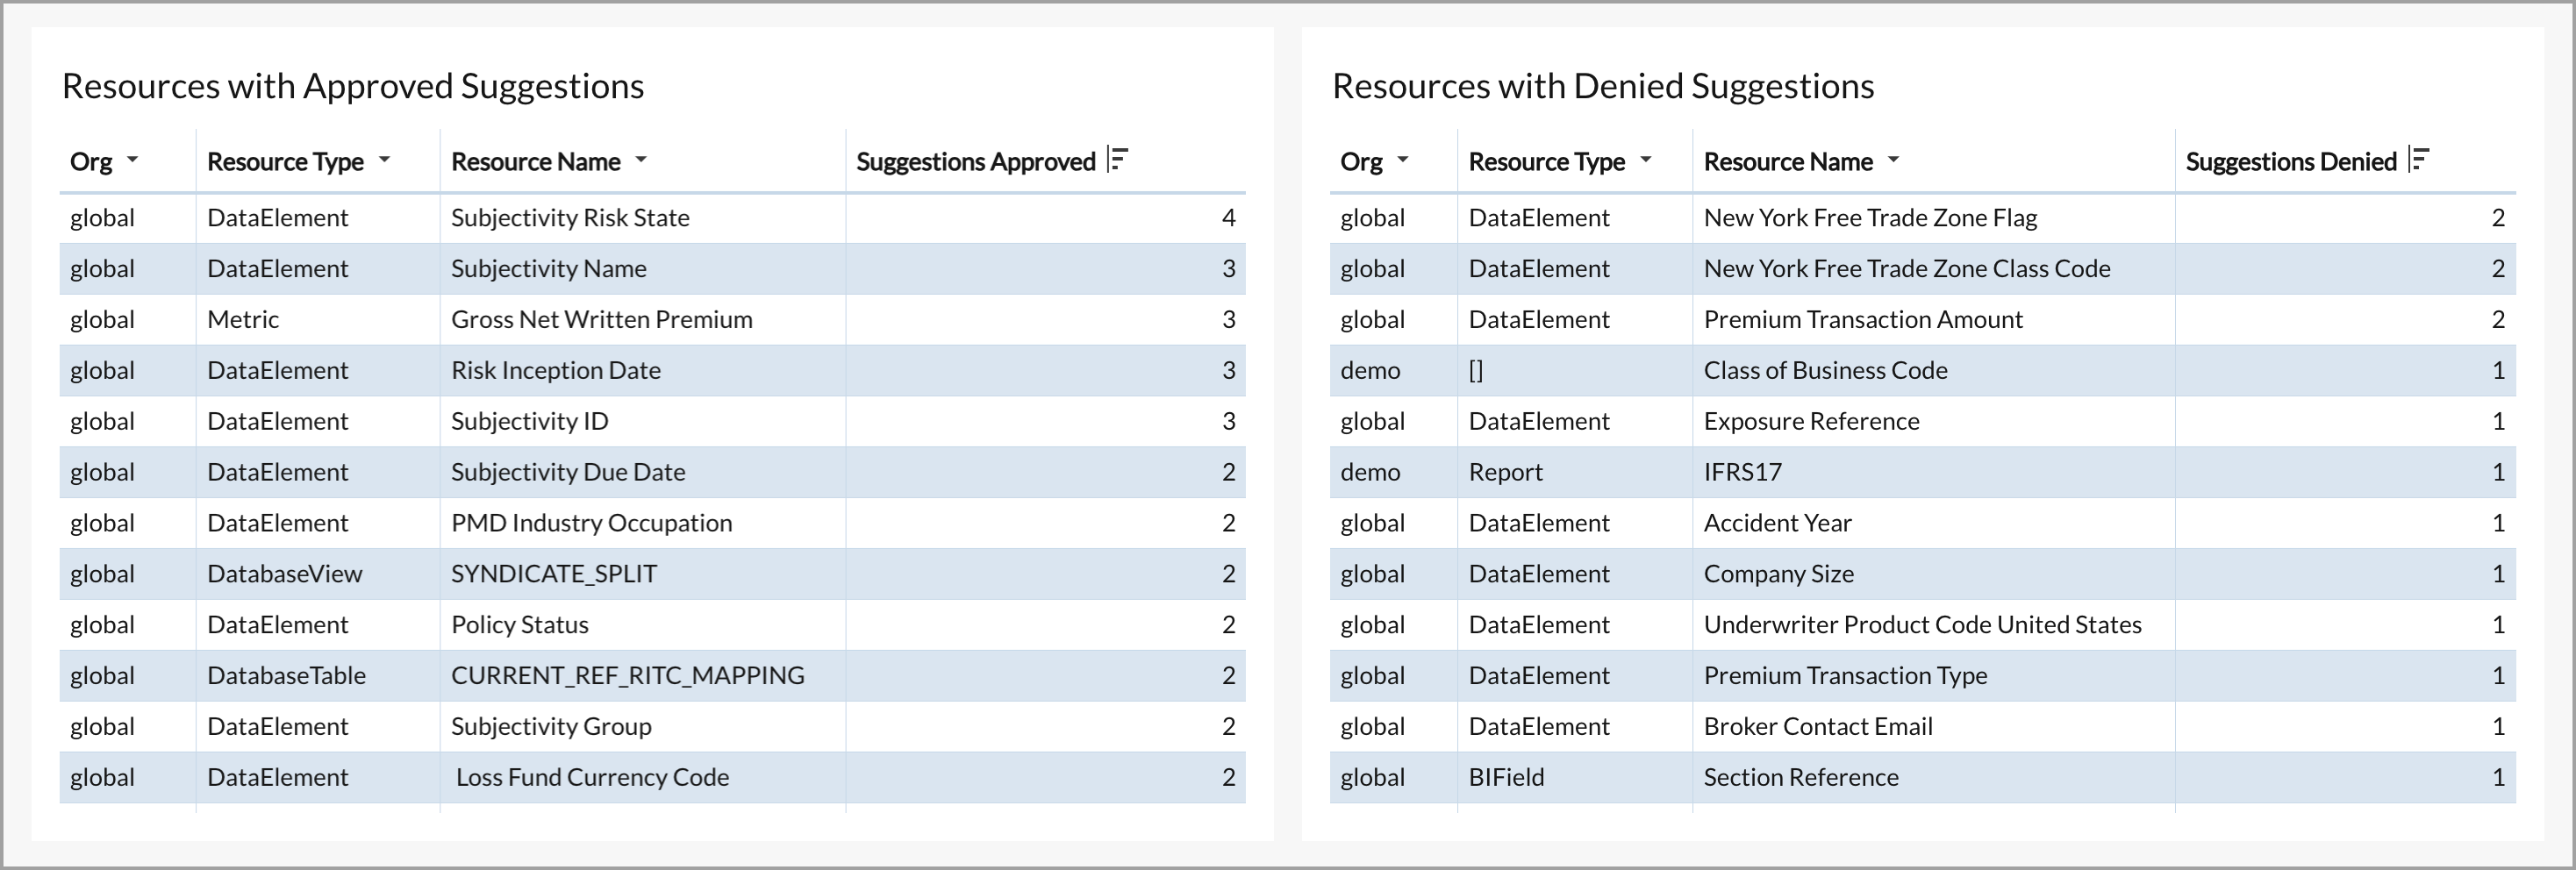
Resources with Approved and Denied Suggestions | Displays a table showing organization, resource type, resource name, and amount of suggestions approved or denied, helping assess which resources receive the most input from users. |
Exploring resource activity on the dashboard
To explore resource activity on the dashboard:
Go to the Dashboards page and click Resources in the left pane.
The dashboard displays key resources metrics.
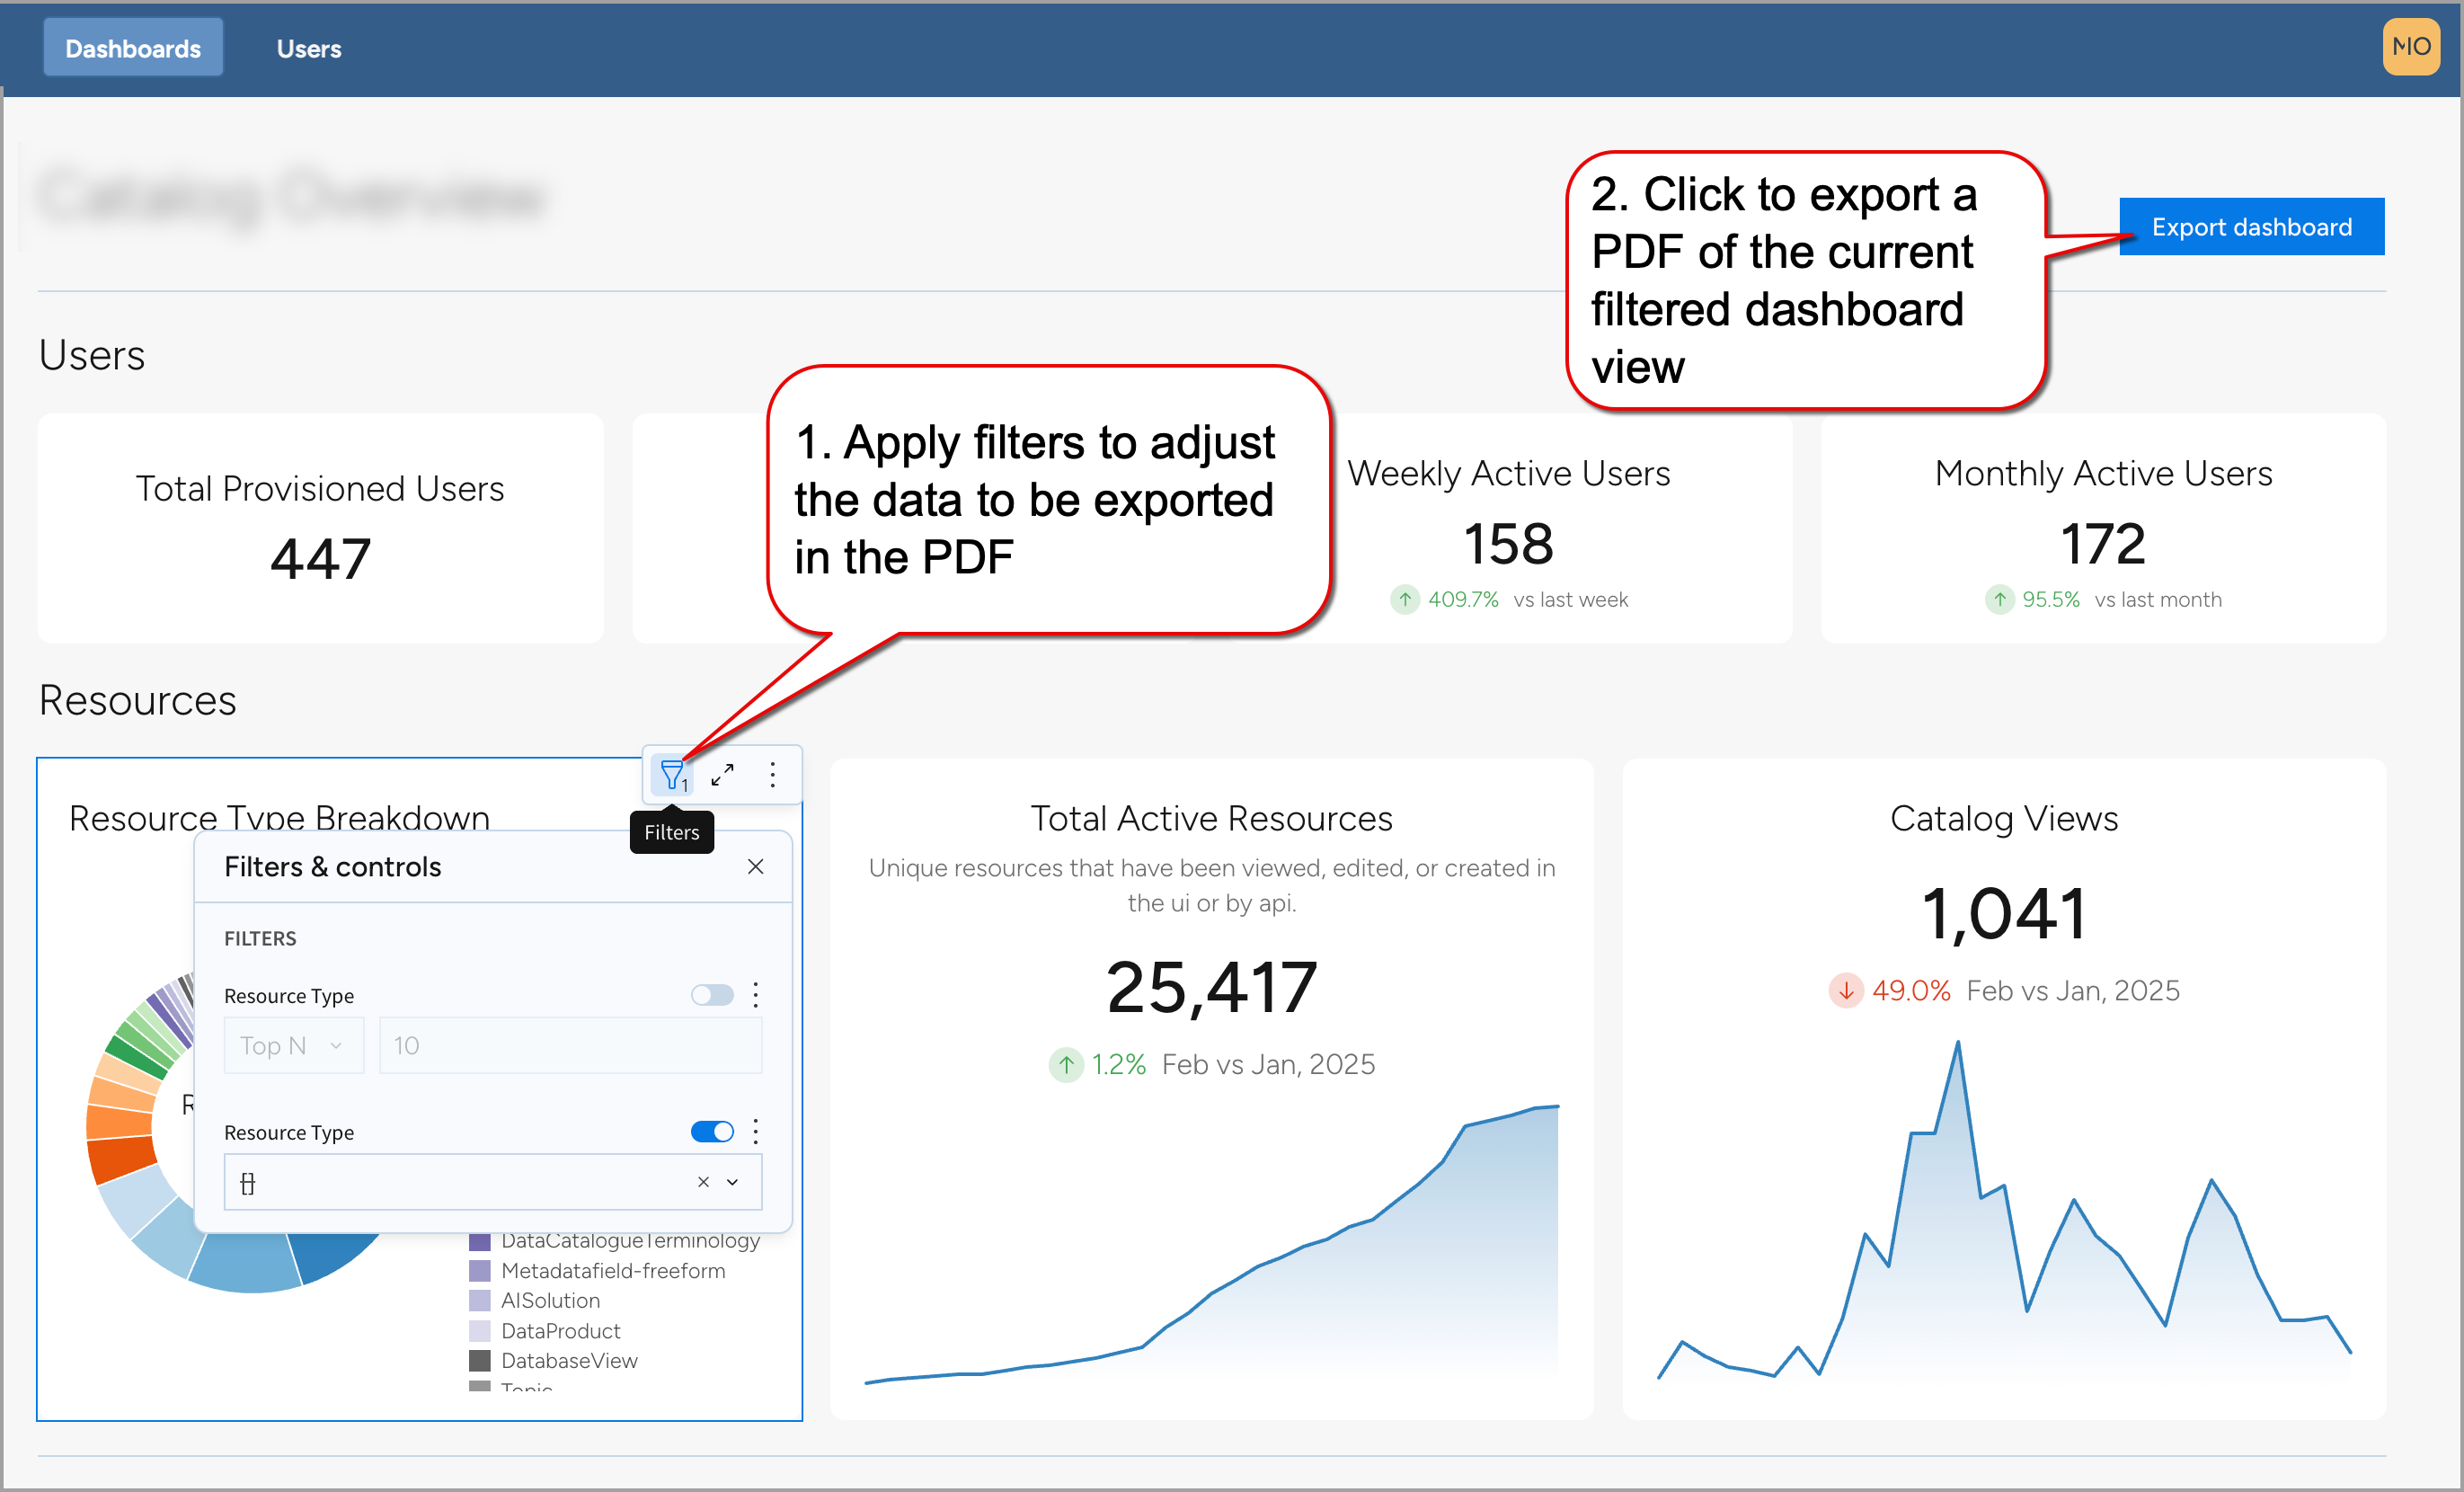
To export the entire dashboard view, click the Export dashboard button. This captures a snapshot of all visible widgets and applied filters as a PDF — ideal for sharing, reporting, or archiving. For details, see Exporting dashboards
To export data or visualizations from individual dashboards, hover over any widget and click the Three-dot menu > Export. Available formats include CSV, JSON, Excel, PNG, and others.
Click the Three dot menu in any dashboard and select Refresh data to update the dashboard.
To expand a specific dashboard, hover over it and click Maximize Element. The expanded view shows a detailed view of the underlying data of the dashboard elements.
Filtering and analyzing resource activity
Each dashboard includes filter options to refine data and analyze resource activity trends in detail.
To filter and analyze resource activity trends:
To apply a filter on all dashboards on the page, click the Global Filters button. In the Global Dashboard Filters window, select from the following:
Select Exclude Users by Selection to remove specific users from the dashboards.
Use Filter Users by Email Text to filter out users by specific criteria.
Use Remove Deactivated Users to filter out deactivated users.
To use the filters for specific dashboard, hover over a dashboard and click Filters.
Use the following filtering options for all the dashboards on the page.
Organizations: Choose specific organizations to filter the data and refine the results.
Date Range: Define a custom timeframe to analyze resource activity. Click the dropdown menu and select a predefined range (for example, Last 90 days). Check Include Today to incorporate the latest data.
Resource Types: Select the type of resources displayed.
Use the following additional filtering for the Top Resource Types and Most Viewed Resources dashboards:
Amount of Resources: Adjust the number of displayed results beyond the default top 10 to expand or narrow the list.
Use the following additional filtering for the Top Suggestors and Resources with Approved and Denied Suggestions dashboards:
Amount of Suggestions: Set a number of suggestions in the entry to filter displayed results.
To view the total number of suggestions: Right-click inside the Top Suggestors table and select Show all totals to quickly access overall suggestions statistics.
Sort and organize data:
Click the Column header name in the dashboard to access sorting options. Use available sorting options to arrange data effectively.
Click Column details to view summaries and insights about a specific column.
Copying and analyzing data:
Right-click any value inside a table and select Copy to clipboard to copy specific data values.
Use sorting and filtering tools to focus on specific resource activity and high-value users.
Exporting dashboards
You can export the entire dashboard view as a PDF file. This is useful for sharing dashboard insights with others, archiving reports, or including snapshots in presentations.
The export captures all visible charts and widgets on the page, along with any filters that are currently applied.
To export the dashboard as a PDF:
Apply filters to customize the data shown in the export. For example, you can filter by date range, resource type, or specific metrics to tailor what appears in the final PDF.
Click the Export dashboard button at the top of the page.
The PDF file is saved automatically to your local device. The export reflects the current visible state of the dashboard, including all applied filters and settings.