Viewing knowledge token dashboards
Knowledge Token dashboards provide insights into how Knowledge Tokens (KT) are consumed when users interact with Archie Chat or use Archie Enrich features. It also includes KT consumption insights for the AI Context Engine Service (Data Analyst Agent and Catalog Agent).
Use these dashboards to:
Monitor Knowledge Token usage by users within your organization.
View the top questions asked via the Catalog Agent in data.world.
Analyze trends in Archie Chat and Archie Enrich activities. Also includes trends in the AI Context Engine service (Data Analyst Agent Events)
Key Knowledge token dashboards
Explore the following dashboards available on the Knowledge Token dashboard page. These dashboards provide visibility into run execution, Knowledge Token spend, and user engagement.
Note
Knowledge Tokens are consumed based on the compute time required for Archie to process a request. As a result, usage may appear in fractions — it reflects time spent, not the number of searches.
Knowledge Token (KT) Spend and Run Activity Metrics
These dashboards track Knowledge Token expenditure and activity metrics across agents.
Dashboard | Details | Source for the dashboards |
|---|---|---|
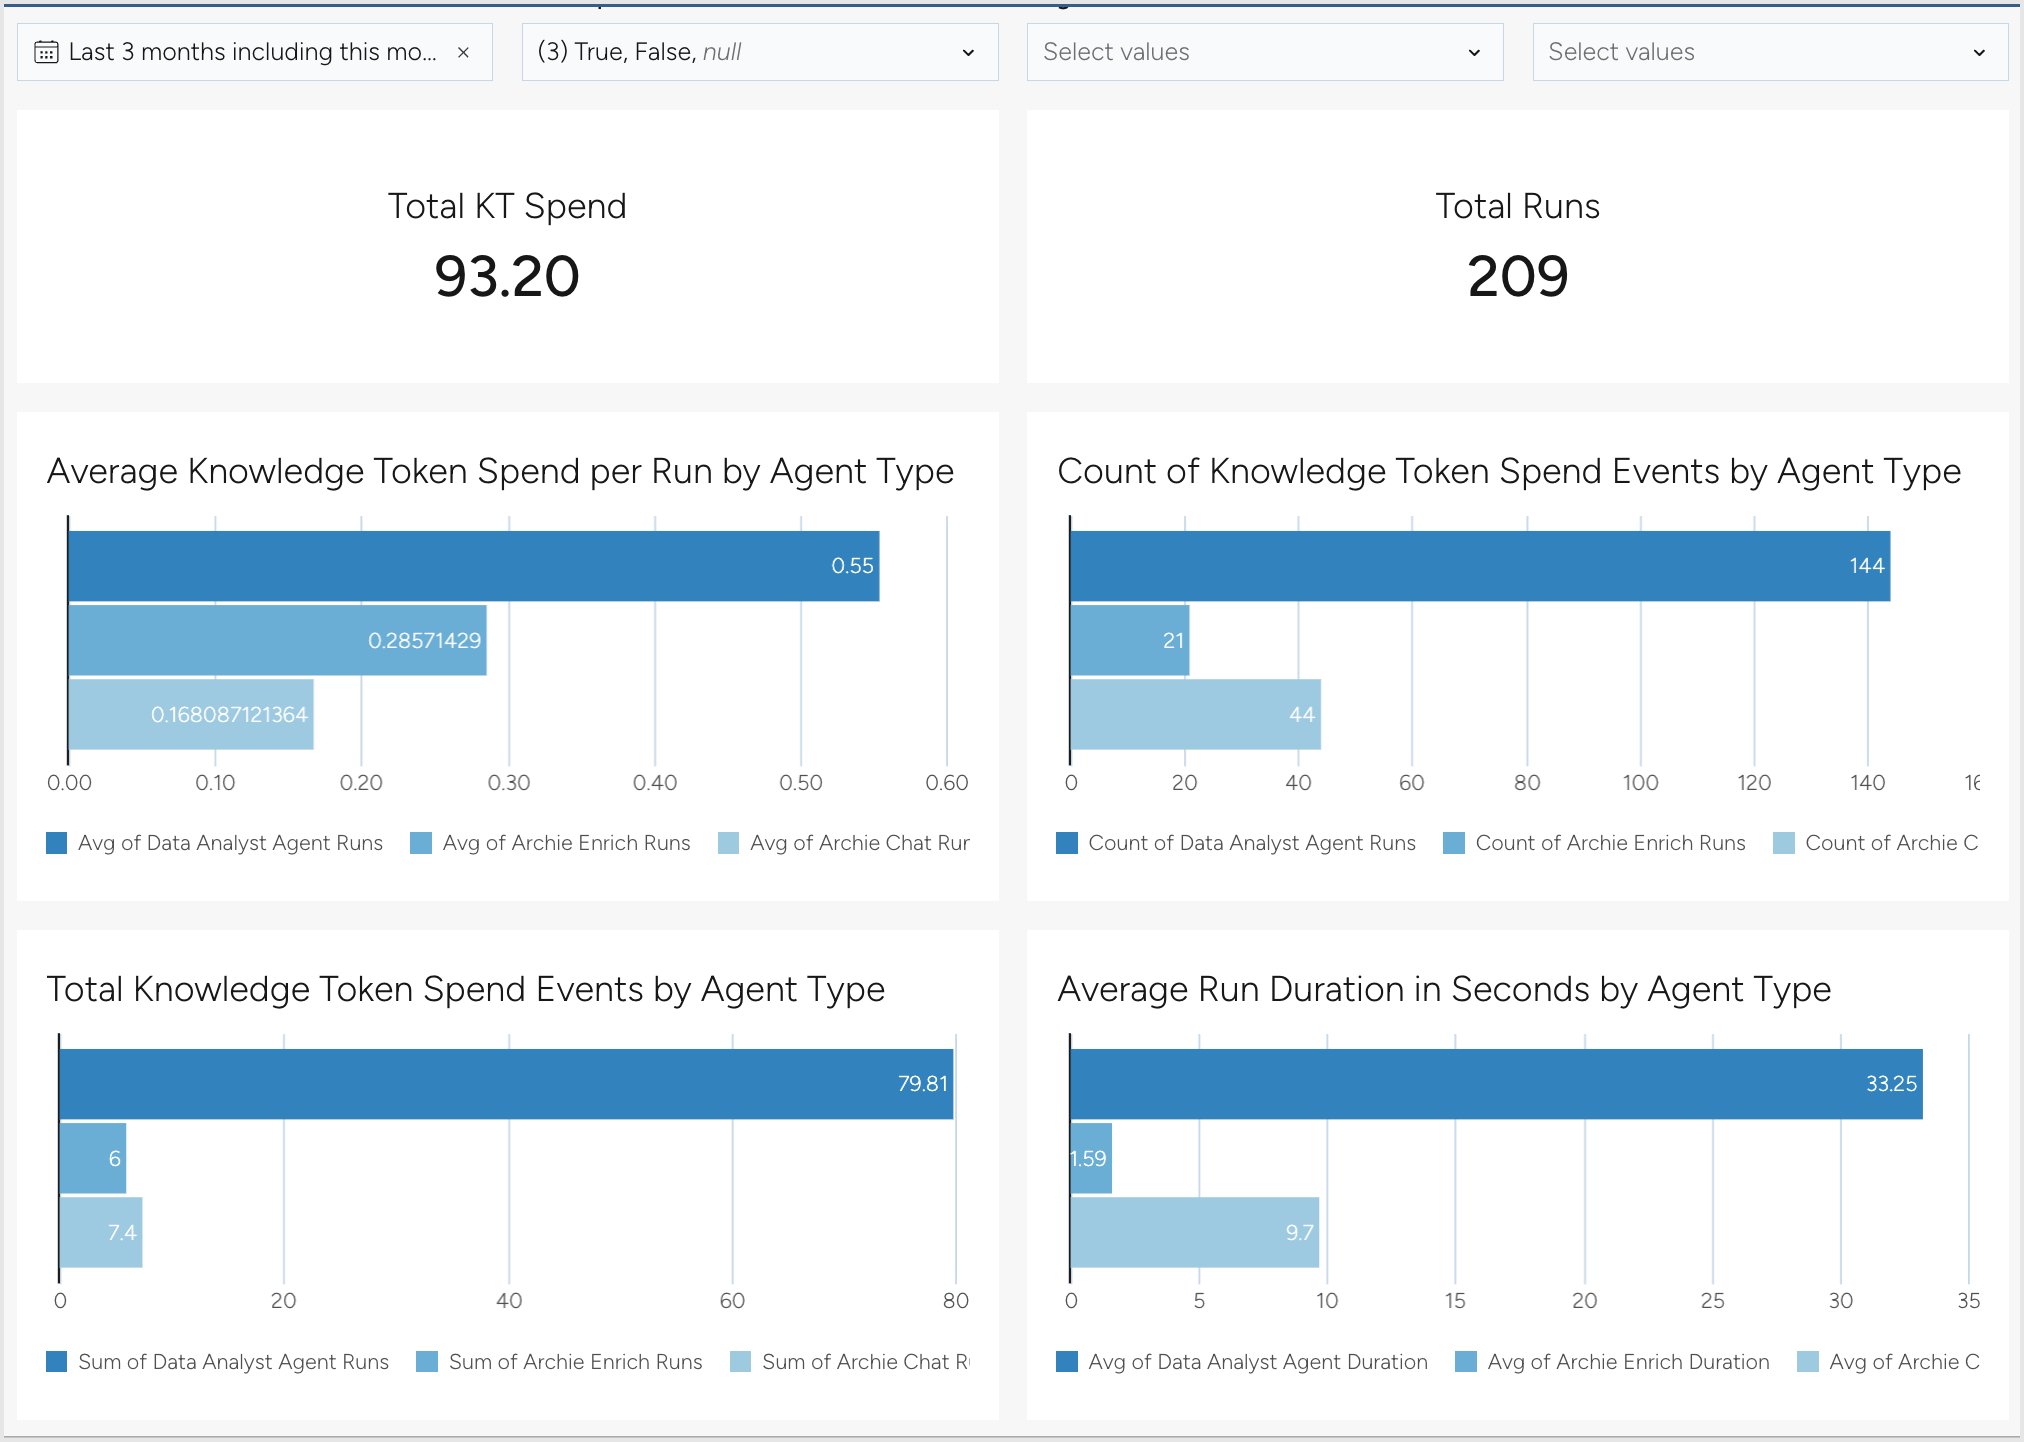
Total KT Spend | Displays the cumulative amount of Knowledge Tokens spent across the platform. |
|
Total Runs | Indicates the number of runs that involved Knowledge Token expenditure. | |
Total Knowledge Token Spend by Agent Type | Breaks down Knowledge Token spend according to different agent types, offering a comparative view. | |
Average Knowledge Token Spend per Run by Agent Type | Calculates the average Knowledge Token expenditure per run, segmented by agent type. | |
Count of Knowledge Token Spend Events by Agent Type | Counts the number of Knowledge Token spend events, categorized by agent type. | |
Average Run Duration in Seconds by Agent Type | Displays the average duration of runs, segmented by agent type, measured in seconds. |
Spend Metrics by Service
These dashboards track the spending associated with specific services, providing temporal insights.
Dashboard | Details | Source for the dashboards |
|---|---|---|
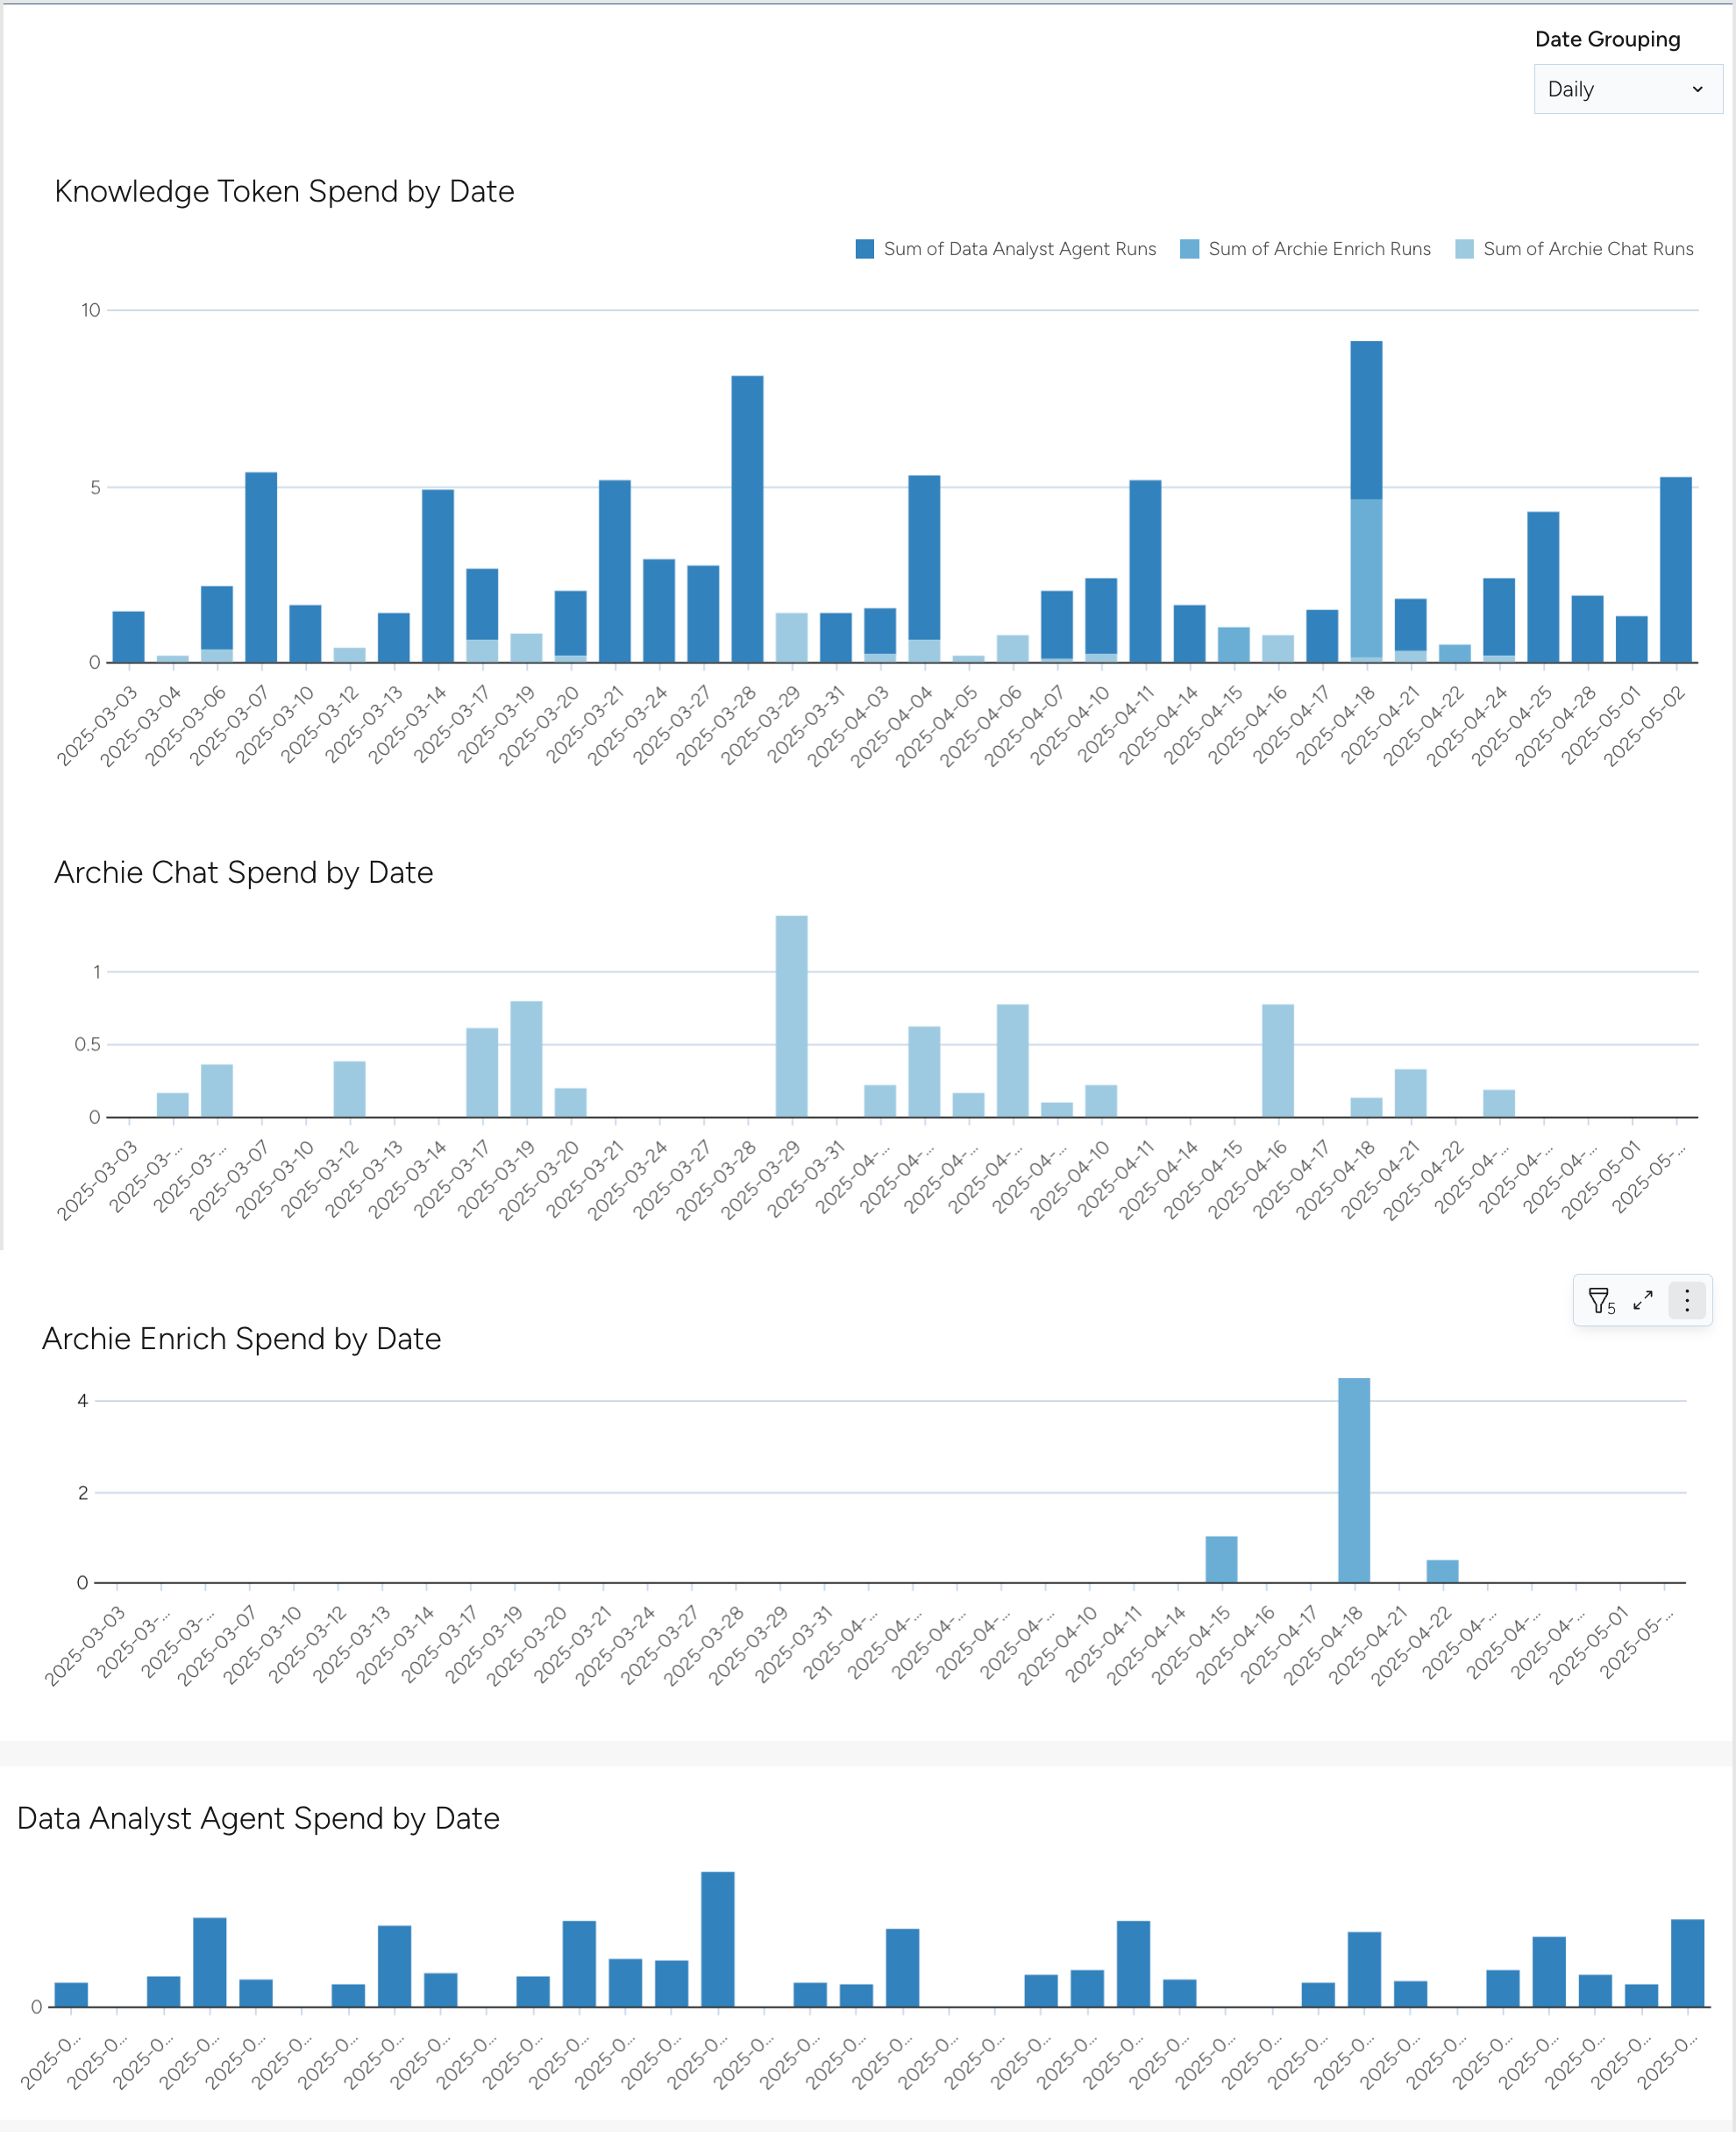
Knowledge Token Spend by Date | Presents a time series analysis of Knowledge Token spending, highlighting trends over specific periods. | Sourced from tables:
|
Archie Chat Spend by Date | Tracks Knowledge Token (KT) usage for the Archie Chat service over time. Usage rate:
| |
Archie Enrich Spend by Date | Monitors the expenditure on the Archie Enrich service over time. Usage rate:
| |
Data Analyst Agent Spend by Date | Monitors expenditure associated with the Data Analyst Agent (AI Context Engine service). Usage rate:
|
User Engagement Metrics
These dashboards focus on user interactions, highlighting popular queries and consumption patterns.
Dashboard | Details | Source for the dashboards |
|---|---|---|
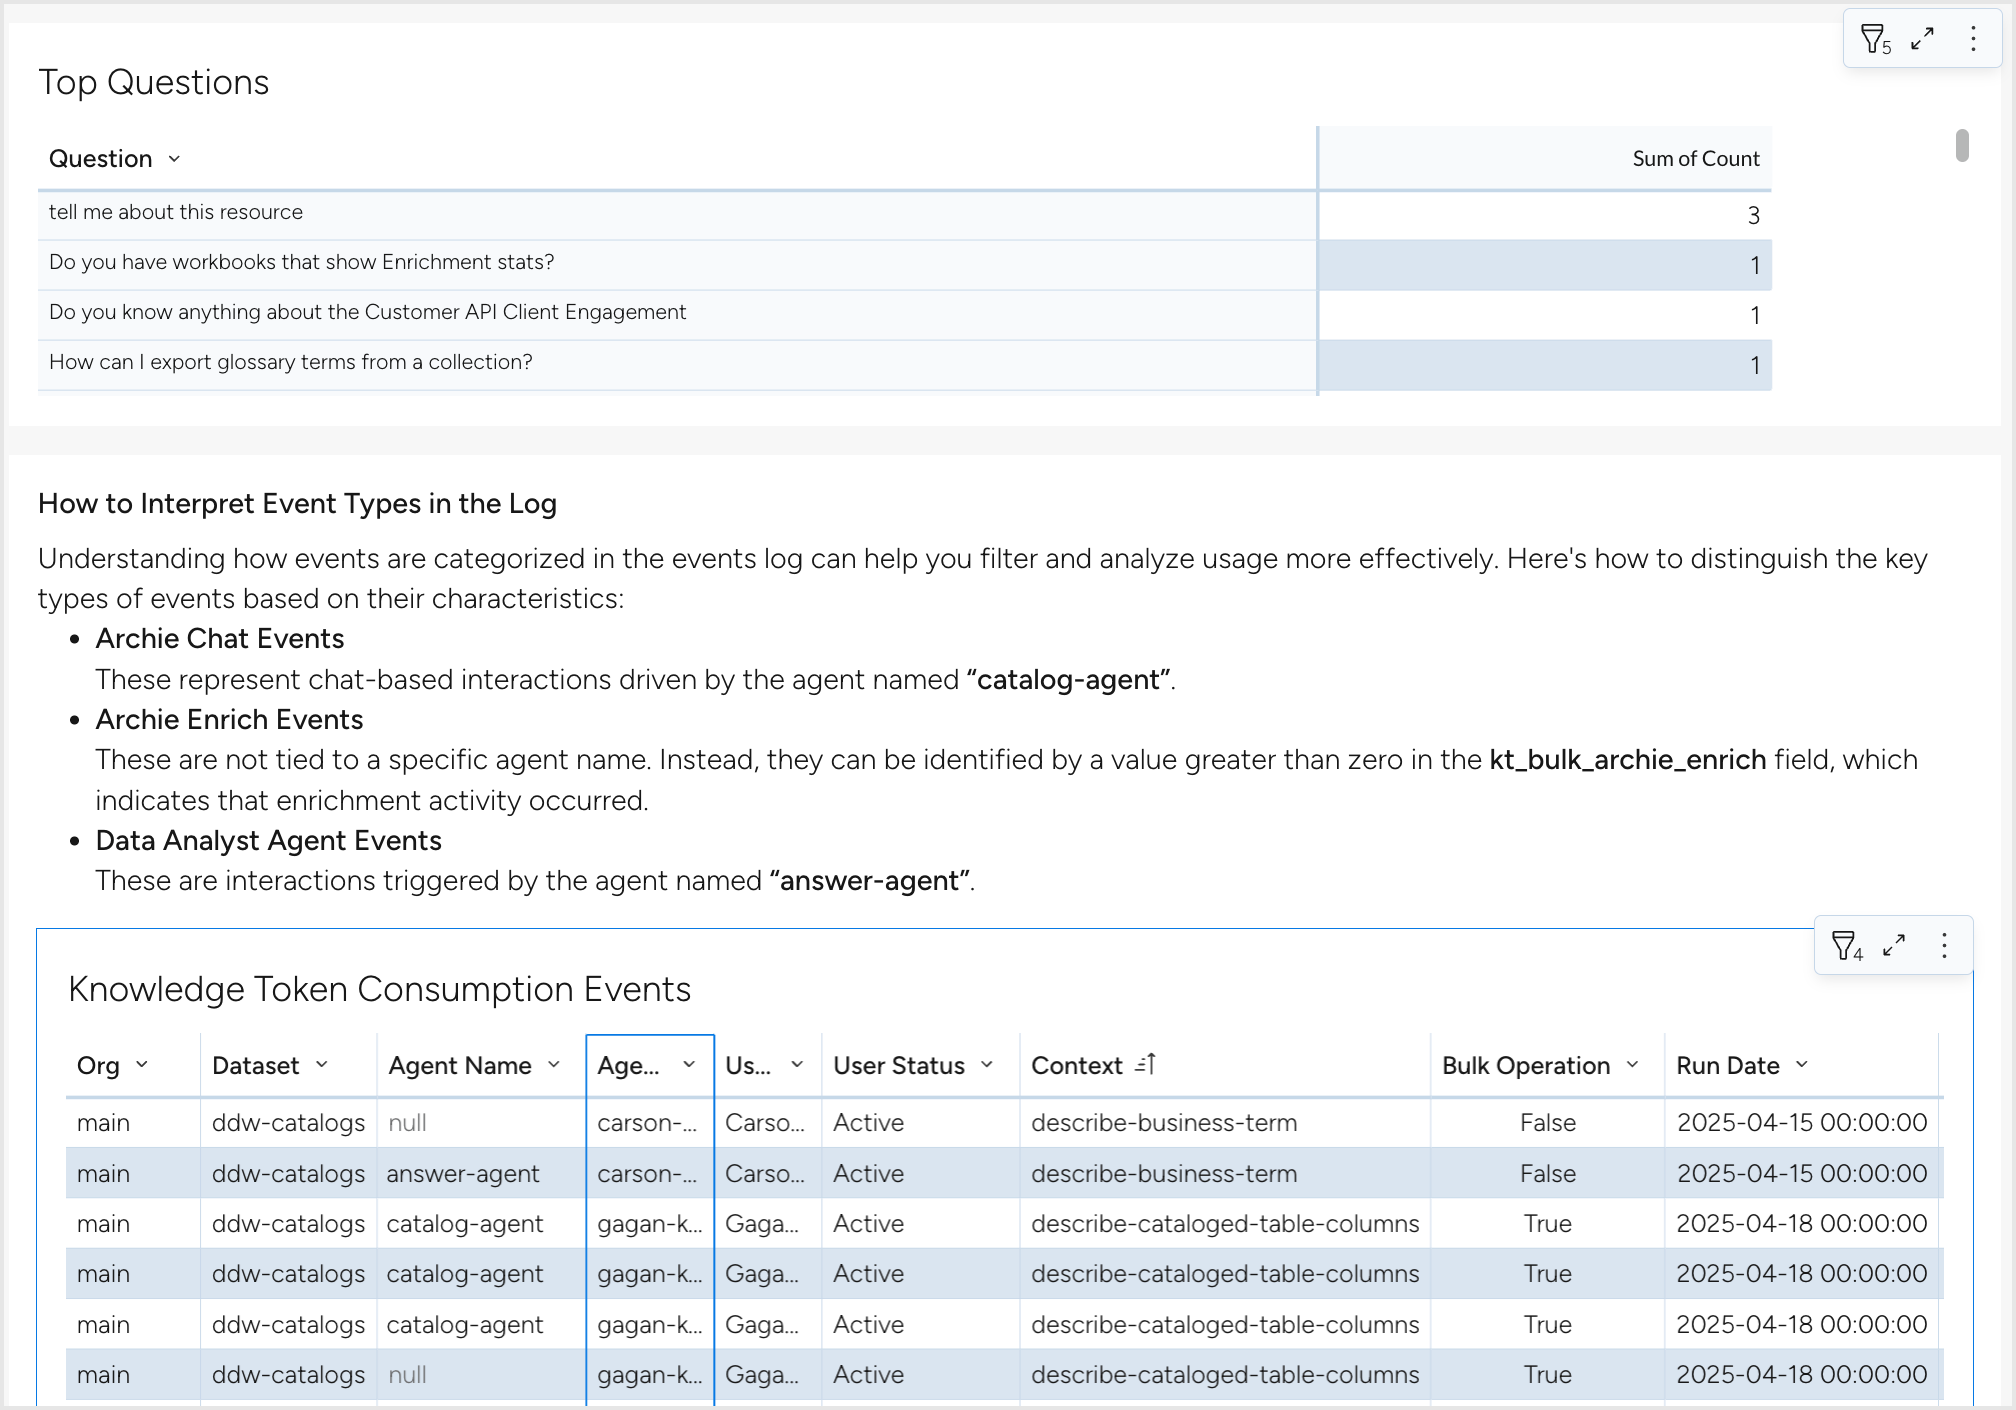
Top Questions | Lists the most frequently asked questions by users, indicating areas of high interest or concern. | Sourced from tables:
|
Knowledge Token Consumption Events | Details each event where Knowledge Tokens were consumed, providing granular insight into usage patterns. |
How to Interpret Event Types in the Knowledge Token Consumption Events dashboard?
Understanding event types helps filter and analyze Knowledge Token usage effectively:
Archie Chat Events: These represent chat-based interactions driven by the agent named “catalog-agent.
Archie Enrich Events: These are not tied to a specific agent name. Instead, they can be identified by a value greater than zero in the kt_bulk_archie_enrich field, which indicates that enrichment activity occurred.
Data Analyst Agent Events: These are interactions triggered by the agent named answer-agent.
Exploring knowledge token data on the dashboard
To explore knowledge tokens data on the dashboard:
Go to the Dashboards page and click Knowledge Tokens in the left pane.
The dashboard displays key knowledge token metrics.
To export the entire dashboard view, click the Export dashboard button. This captures a snapshot of all visible widgets and applied filters as a PDF — ideal for sharing, reporting, or archiving. For details, see Exporting dashboards
To export data or visualizations from individual dashboards, hover over any widget and click the Three-dot menu > Export. Available formats include CSV, JSON, Excel, PNG, and others.
Click the Three dot menu in any dashboard and select Refresh data to update the dashboard.
To expand a specific dashboard, hover over it and click Maximize Element. The expanded view shows a detailed view of the underlying data of the dashboard elements.
Filtering and analyzing Knowledge Token data
Each dashboard includes filter options to refine data and analyze Knowledge Token usage trends in detail.
To filter and analyze knowledge token usage trends:
To apply a filter on all dashboards on the page, click the Global Filters button. In the Global Dashboard Filters window, select from the following:
Select Exclude Users by Selection to remove specific users from the dashboards.
Use Filter Users by Email Text to filter out users by specific criteria.
Use Remove Deactivated Users to filter out deactivated users.
To use the filters for specific dashboard, hover over a dashboard and click Filters.
Use the following filtering options for all the dashboards on the page.
Run Date: The calendar date when the agent run occurred.
Bulk Operation: Indicates whether the run was part of a bulk operation.
Organizations: Choose specific organizations to filter the data and refine the results.
User Name: The name of the user who used the knowledge token.
Use the following additional filtering for the Knowledge Token Spend by Date, Data Analyst Agent Spend by Date, Archie Enrich Spend by Date, and Archie Chat Spend by Date dashboards:
Date grouping: Group the data by Daily, Weekly, Monthly.
Sort and organize data:
Click the Column header name in the dashboard to access sorting options. Use available sorting options to arrange data effectively.
Click Column details to view summaries and insights about a specific column.
Copy and analyze data:
Right-click any value inside a table and select Copy to clipboard to copy specific data values.
To view total values, right-click and select Show all totals. For example, total searches by the most active users.
Exporting dashboards
You can export the entire dashboard view as a PDF file. This is useful for sharing dashboard insights with others, archiving reports, or including snapshots in presentations.
The export captures all visible charts and widgets on the page, along with any filters that are currently applied.
To export the dashboard as a PDF:
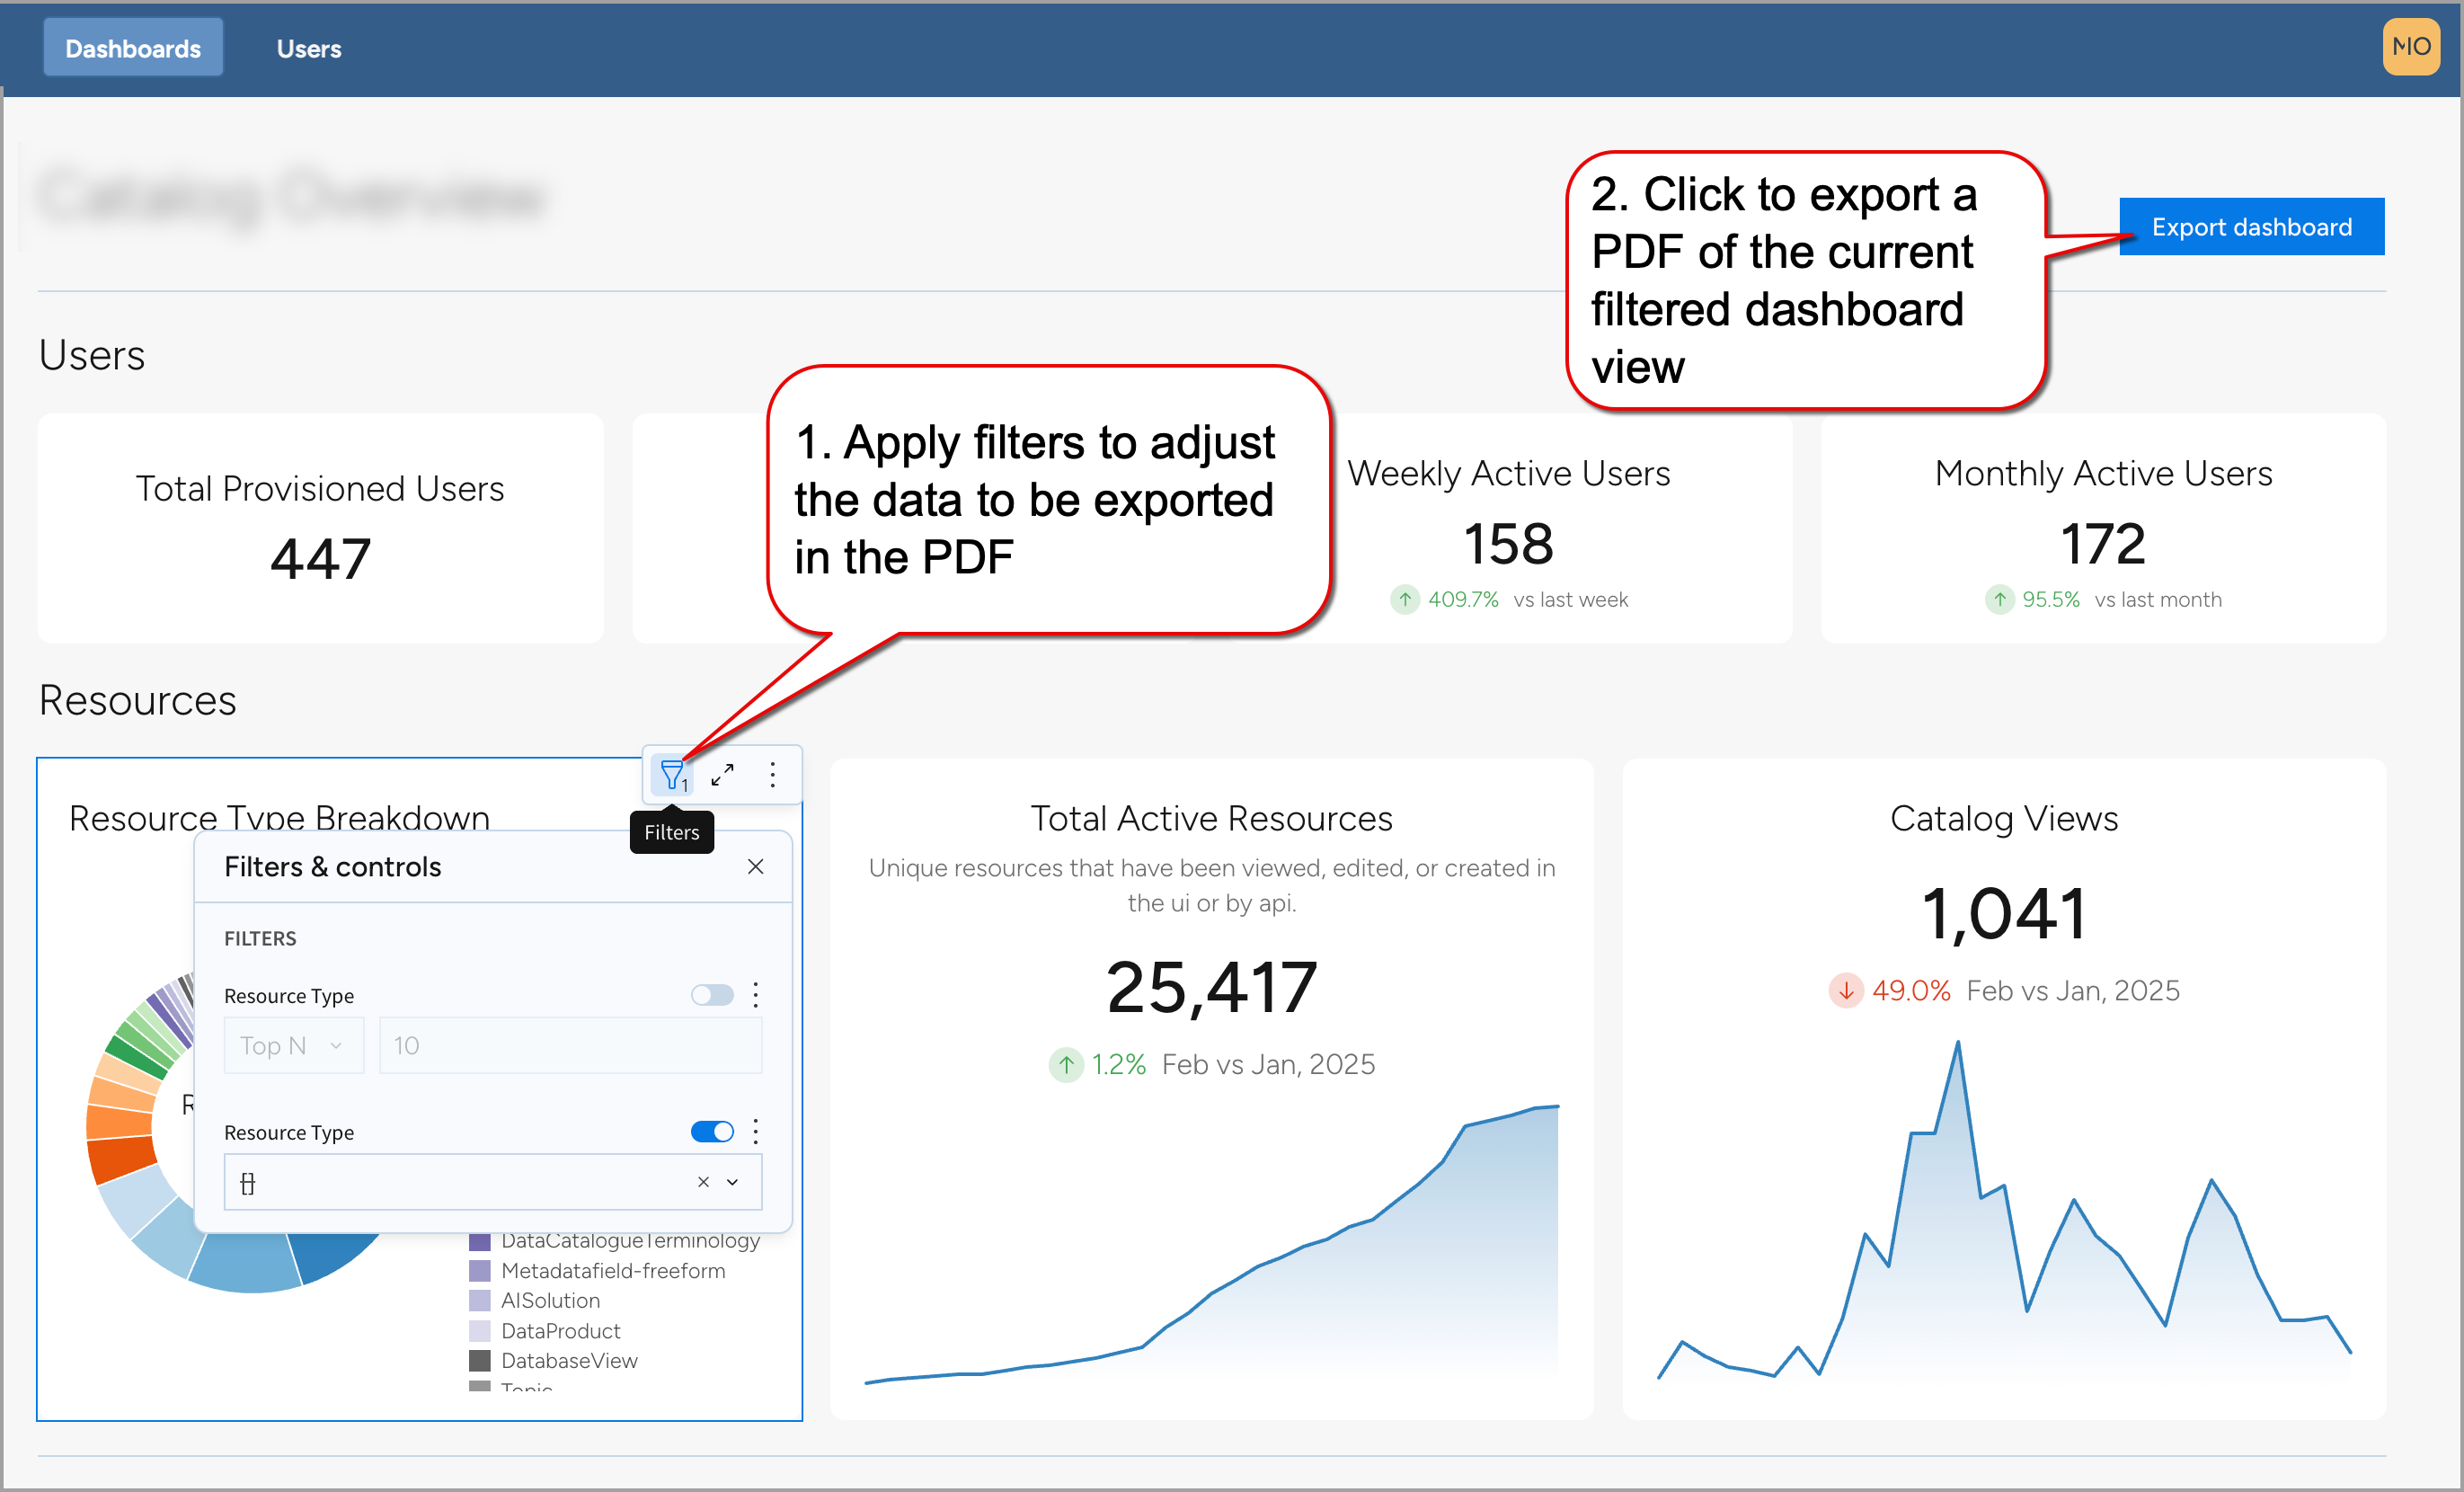
Apply filters to customize the data shown in the export. For example, you can filter by date range, resource type, or specific metrics to tailor what appears in the final PDF.
Click the Export dashboard button at the top of the page.
The PDF file is saved automatically to your local device. The export reflects the current visible state of the dashboard, including all applied filters and settings.