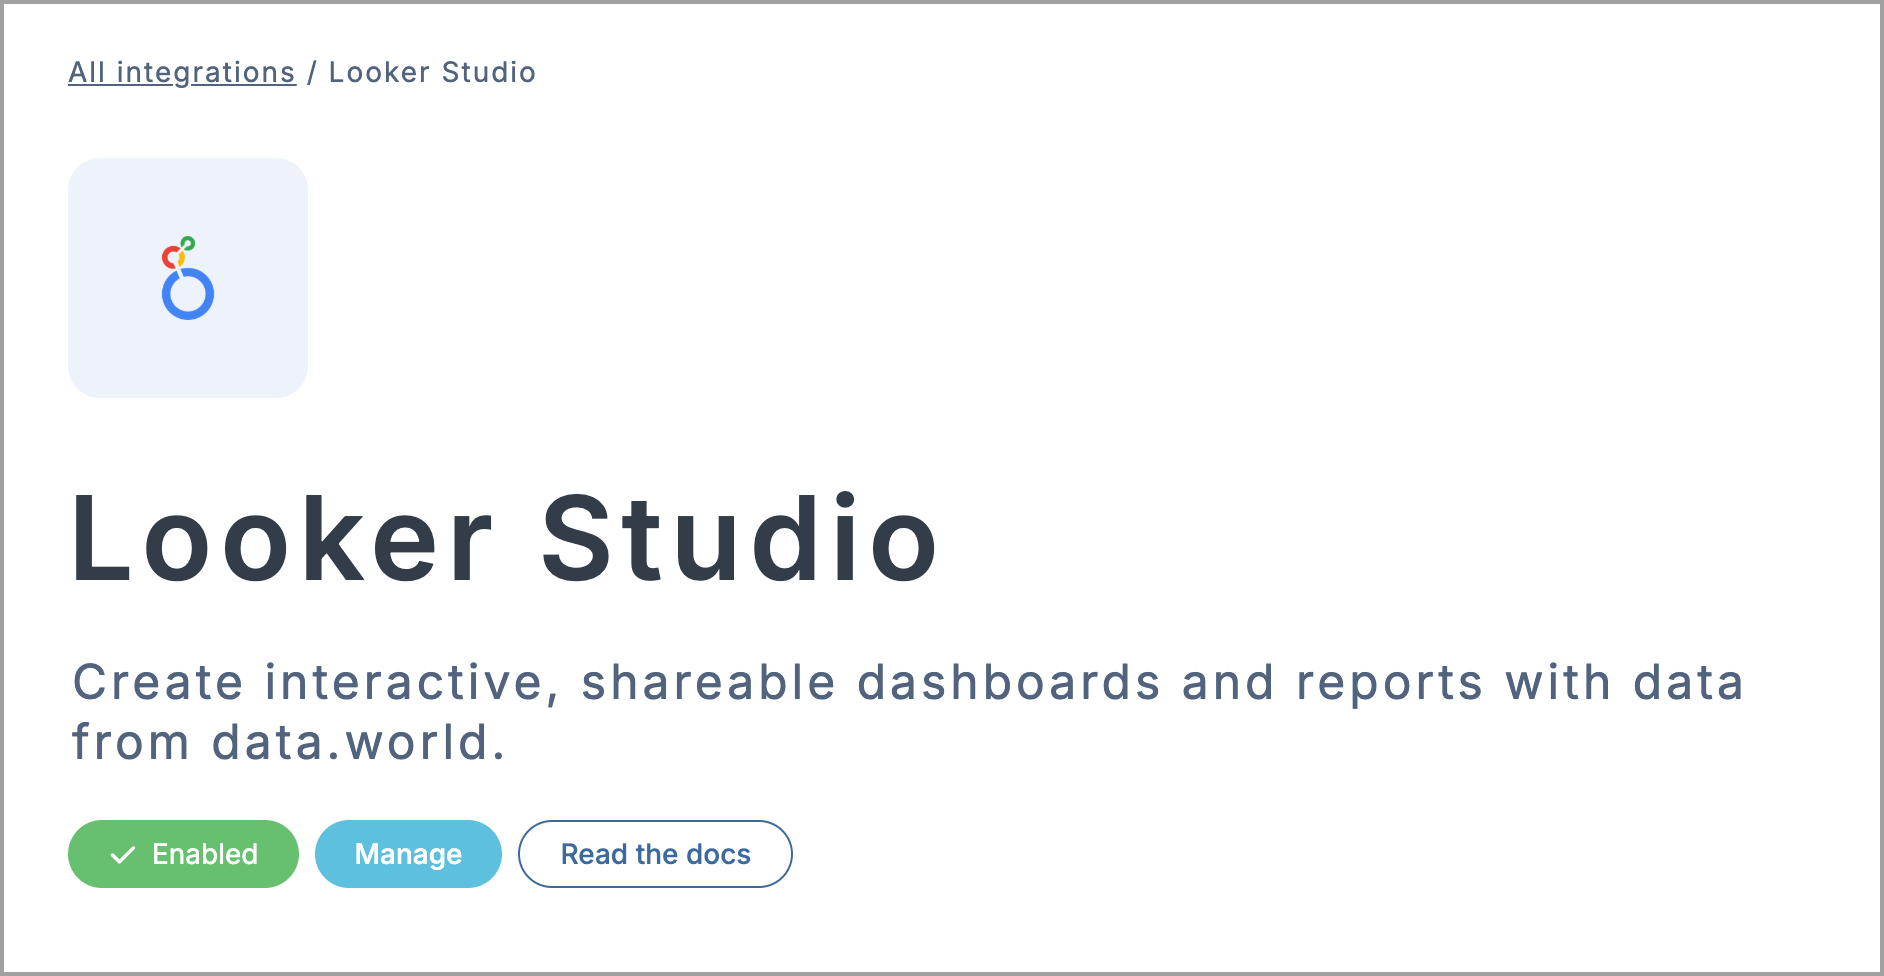
Looker Studio
The data.world integration with Looker Studio helps you create dynamic, customizable dashboards and reports using your datasets and projects. Visualize live query results, combine data from multiple sources, and share insights through interactive reports that update automatically.
This integration is ideal for analysts, storytellers, and decision-makers who want to bring data to life and keep teams aligned—without manual effort.
Key benefits include:
Connect to data.world with SQL: Use SQL queries to pull exactly the data you need from any dataset or project on data.world.
Build live dashboards: Visualize data that updates automatically every 12 hours, helping teams stay in sync without manual refreshes.
Customize reports for impact: Create charts, tables, and scorecards using Looker Studio intuitive editing tools—no coding required.
Combine multiple sources: Blend data from data.world with sources like Google Sheets or BigQuery to create a single view of your metrics.
Share and collaborate: Embed dashboards, generate shareable links, or schedule email reports to keep everyone informed.
Enabling Looker Studio integration
Before using Looker Studio with your data, you will need to enable the integration. Whether you start from the integration settings or from within a dataset, both flows will guide you through connecting your Google account and unlocking reporting features.
Enabling the integration from the Integration gallery
To enable the Looker Studio integration from the Integration gallery:
Go to the Looker Studio integration page on data.world.
Click Enable integration and review the requested permissions.
Click Authorize Google Data Studio to confirm. Once authorized, the integration will be enabled for your account.
You can now launch Looker Studio directly from any dataset or project using the Open in app button.
Enabling the integration from a dataset or project
To enable Looker Studio integration from a dataset or project:
Open the dataset or project where you want to use Looker Studio.
For projects: Open the file in the Project workspace, then click the Open in app button in the right panel.
For datasets: In the Files section, find your data source and click the Open in app icon.
In the Open in a third-party app window, click Explore more integrations.
From the list, select Looker Studio to open the integration page.
Click Enable integration > Authorize Google Data Studio to complete setup. Once authorized, the integration will be enabled for your account.
Click Back to my dataset to return and begin using Looker Studio via the Open in app button.
Importing data from data.world into Looker Studio
After enabling the integration, you can import data into Looker Studio directly from a data.world dataset or project. Use SQL queries to select the exact data you want to visualize in a live, interactive report.
To import data from data.world into Looker Studio:
Go to the dataset or project page on data.world.
For projects: Open the Project workspace, select the relevant file, and click the Open in app button > Looker Studio.
Note
If the integration is already enabled, you will see the Open with Looker Studio option—click it to continue.
For datasets: In the Files section, locate your data source and click the Open in app icon > Looker Studio.
The Untitled Data Source page opens in Looker Studio. Under the data.world authorization section, click Authorize.
When prompted, choose the instance you want to use. If your team uses a different instance, click Another data.world instance? and enter your instance name.
In the Dataset or Project URL field, you will see the URL of the dataset or project you launched from. You can leave it as is or replace it with a different valid data.world URL.
In the SQL Query field, you will see a default query (SELECT * FROM tablename) based on your selected source. You can modify this query to focus on specific fields, apply filters, or narrow the dataset.
Click Connect to bring the data into Looker Studio. Once connected, you can refine the fields and start building your report.
Creating a report from connected data
After connecting your data from data.world, you can start building your report in Looker Studio. Choose how your data is presented, add visual elements, and customize the layout to highlight key insights.
To create a report:
In the Field configuration view, review the imported fields before creating the report. You can do the following:
Add descriptions to clarify field purpose.
Change field types as needed.
Remove fields you do not plan to use.
Click Create Report. A confirmation window appears. Click Add to Report to confirm and continue.
Looker Studio opens a blank Untitled Report with your data.world connection listed in the right-side Data Panel.
To start visualizing data, drag a field from the Data Panel onto the canvas to create a new chart. Select any element on the canvas to change its style, data source, or formatting.
Click Insert in the top menu to:
Add charts, such as tables, scorecards, time series, or pie charts.
Insert text boxes for notes, headings, or context.
Upload images or logos to brand your report.
Use filters and controls to make your report interactive. You can add date selectors, dropdown menus, and more.
Adding additional data sources to your report
Looker Studio allows you to combine data from multiple sources in a single report. You can add more datasets from data.world or connect to other platforms to enrich your analysis and build more comprehensive dashboards.
To add another data source to your report:
In the right-side Data Panel, click Add data. The Add data to report window opens.
Choose a new data source from the available options:
Select another data.world dataset and enter a necessary URL and query.
Or connect to external platforms such as Google Ads, Google Sheets, Microsoft Excel, and others.
Follow the steps for the selected connector. This may include authorizing access, entering a URL, or choosing fields.
Click Add to include the new source in your report.
Sharing reports with your team
After building your report, you can easily share it with others using Looker Studio. Whether you are presenting insights, monitoring performance, or aligning teams, shared reports help everyone stay on the same page, spot trends quickly, and make informed decisions—without needing direct access to the raw data.
To share your report:
At the top right of your report, click Share.
From the dropdown menu, choose how you want to share the report:
Invite people: Share directly via email and assign viewer or editor permissions.
Schedule delivery: Automatically send updated reports on a recurring schedule.
Get report link: Generate a public or restricted-access URL.
Embed report: Display your report in dashboards, websites, or internal portals.
Download report: Export the report as a PDF for offline use or documentation.
Click the View mode button to preview how your report will appear to others.
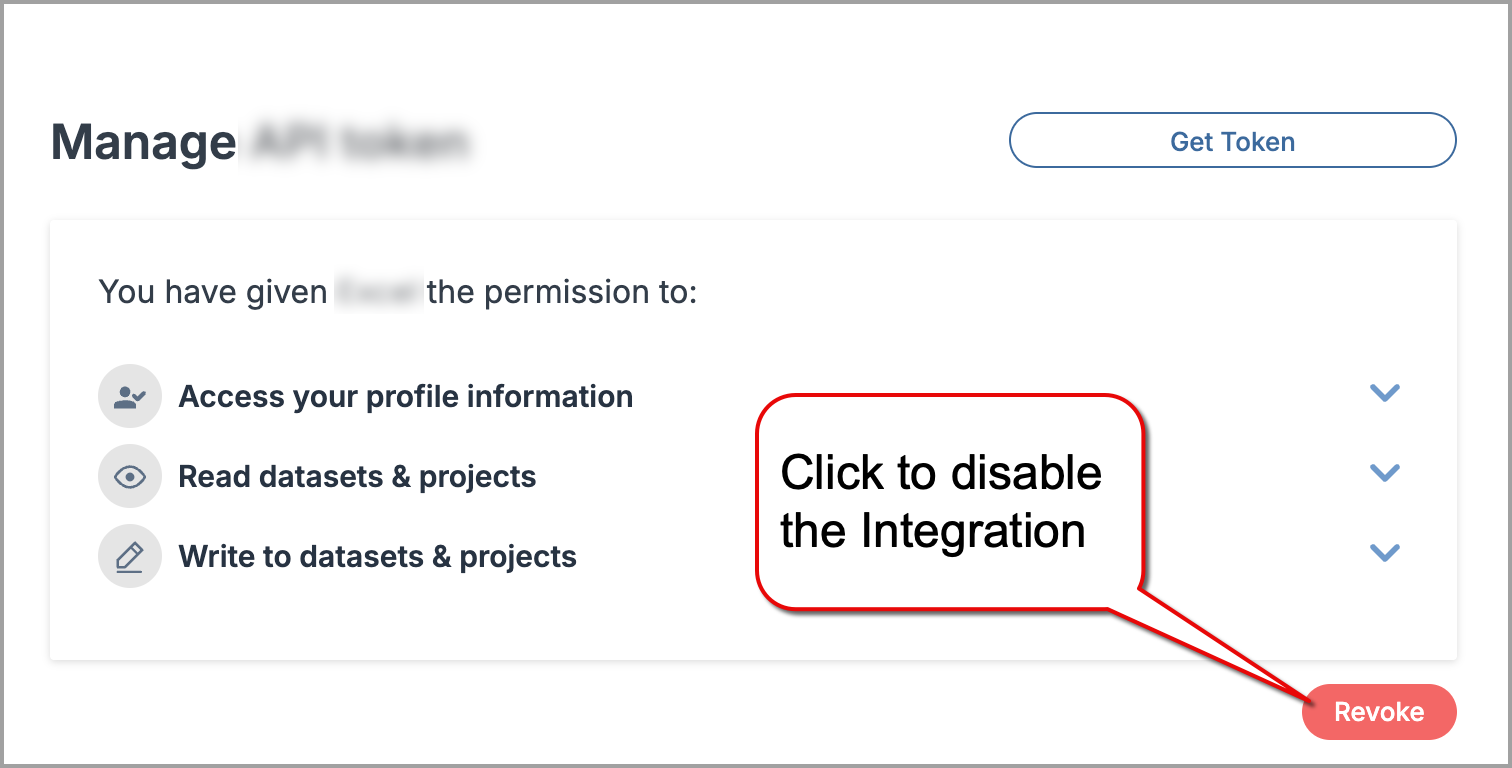
Disabling the integration
Disabling the integration will revoke the application access to your data.world account, datasets and projects data.
Important
To use the integration again, you will need to reconnect and reauthorize access.
To disable an integration:
Go to the integration page.
On the integration page, click the Manage button.
In the Manage section, click Revoke and confirm disconnecting the integration.